Sap flow measurements with Granier method
WATERUSE
Intensive Observation
Period 1 - IOP1
Andria,
Italy
July
22nd to August 3rd, 2003
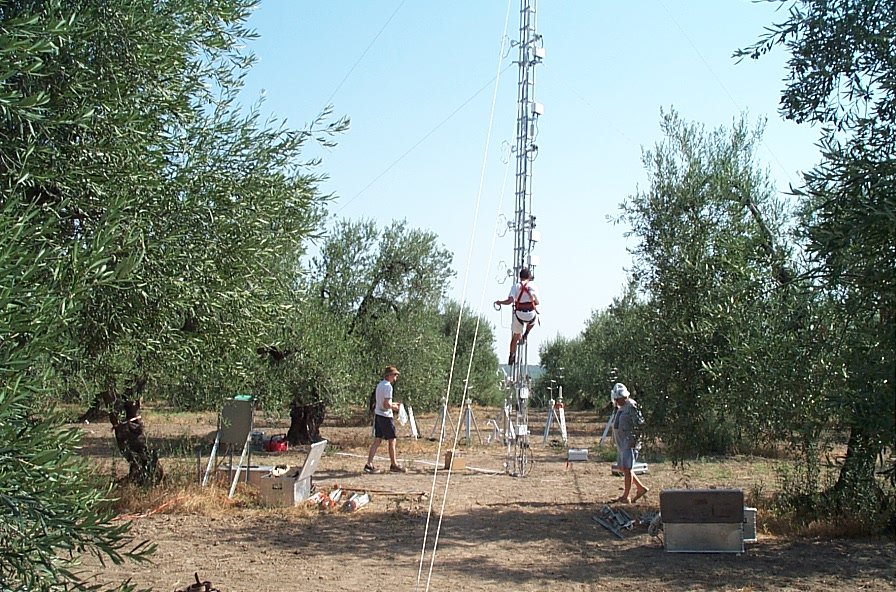
olive
grove in Southern Italy
The IOP1 took place in the olive grove
at the test
site of Andria (Southern
Italy, Apulia, 41°12'N, 16°10'E, 175 m a.s.l.)
from July 22nd to August 3rd, 2003, on approximately
level terrain (2° inclined towards NNE). The average stand age was
100 years.
The distance between the rows was 8.3 m and the tree density was 132
trees per
ha, with an average tree height of 5 m. Between the trees was bare soil
and the
canopy was relatively open. Fetch in the main wind directions (W and N)
was 200
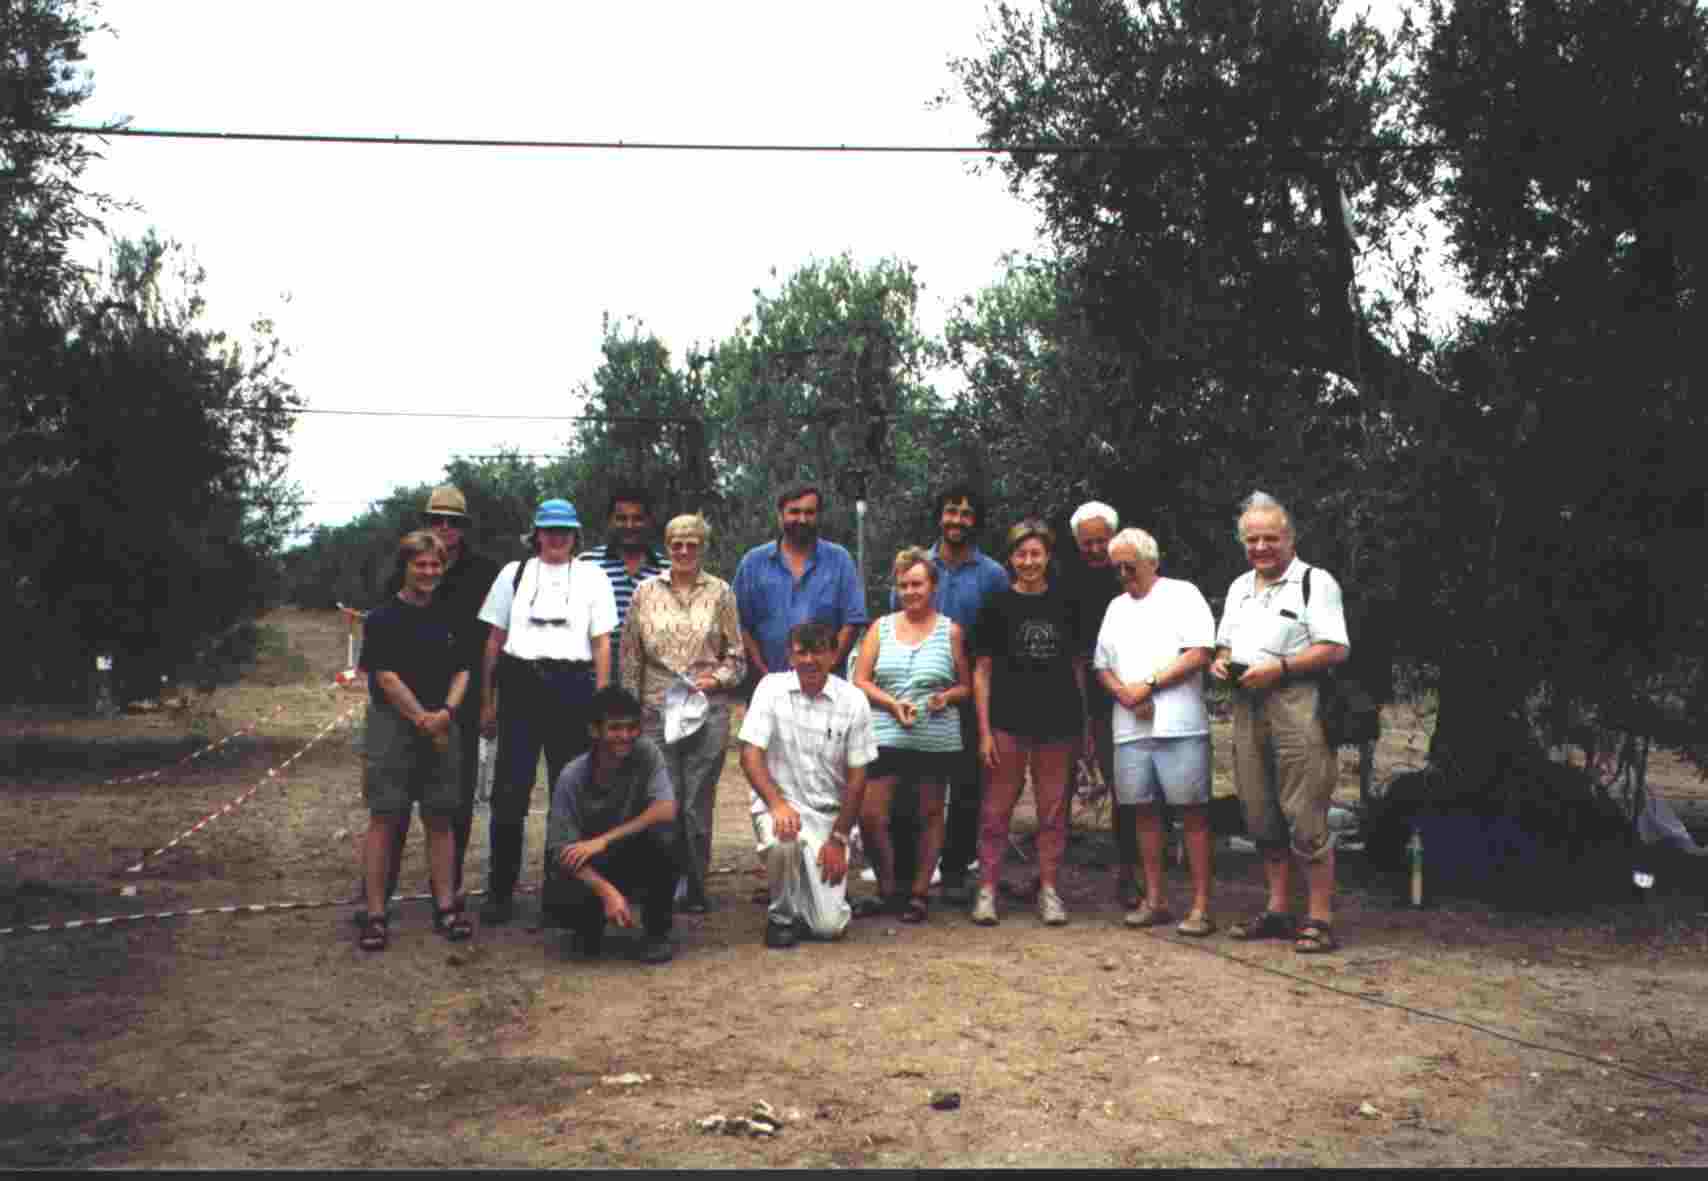
to 300 m. It has been the first official experiment where most of
the
project partners were involved in a common field study, bringing in the
field
instruments and techniques specifically developed in the first year of
the
project, in order to quantify, characterize, and especially partition
water
budget components of a typical agricultural land use system (an
irrigated olive
grove in Southern Italy).
The main objective of the campaign was the concurrent
deployment and use of various, integrated techniques to study water
fluxes in
the different segments of the Soil-Plant-Atmosphere System in a sparse
yet
regular tree canopy system, and understand regulative properties of the
plants
in partitioning water fluxes. Thus, extensive measurements of soil
geo-pedological, physical and especially hydrological properties
were planned
at plot scale, and intensive monitoring of water content at
significant points, too. Plant canopy
structure was also to be investigated by
several destructive and non-destructive techniques. Water flow in the trees was
planned to be investigated by several sap-flow
methods and by
remote-sense
techniques,
integrated by direct stomatal
conductance
measurements. General validation of evapotraspiration
loss to the atmosphere
and eventually partitioning between
transpiration and soil evaporation were
planned to be gathered through analytical micrometeorological
measurements,
based on the eddy covariance technique and the measurements of the
energy
balance components.
A very
extensive survey of soil
electromagnetical
properties was performed by Partner 8 in an area approximately 1
ha large
positioned in the normal daytime footprint of the ET fluxes, using the
Ground
Penetrating Radar technique. It showed interesting features of the soil
structure, especially related to the vertical profile, and spatial
(horizontal)
variability, which demonstrated to be very useful in addressing the
sampling
strategy of other soil measurements, especially geoelectrical and
time-domain
reflectometry. The vertical structure of the soil profile often showed
thick
hard plates of carbonates at 0.2-0.5 m, which could be crucial in
determining
the movement of water in the soil and the root distribution. Two
trenches 1 m
deep and several meters long have been dug out in areas where GPR had
showed
anomalous behaviour or strong gradients of soil electromagnetical
properties,
in order to better understand the resolution capacity of this technique.
Geolectrical methods based of measurement of
electrical resistivity of soil between complex electrodes array
configuration
have been applied by Partner 6 in specific areas of the plot and around
trees
which were monitored also by other techniques (sap flow) . The
inversion of
these readings showed to be able to detect with good resolution the
vertical
stratification of the soil and even the presence of the bigger tree
roots.
Also, the parallel measurements of volumetric water content by
time-domain
reflectometry (TDR) probes,
showed a good correlation between electrical resistivity values and
local water
content. Further validation of these relationships will be possible
after the
analysis of the extensive soil sampling made by Partner 9 at the same
locations
where geoelectrical methods have been applied. Partner 6 also studied
infiltration properties of the soil, yielding interesting information
on proper
irrigation management.
Similar (geo)electrical techniques were
applied to the
study of the resistivity of trunk sections, demonstrating quite well
the
diameter of the heart wood. These measurements have been carried out in
strict
cooperation with Partner 5, on trees where sap flow measurements were
also run
at the same time.
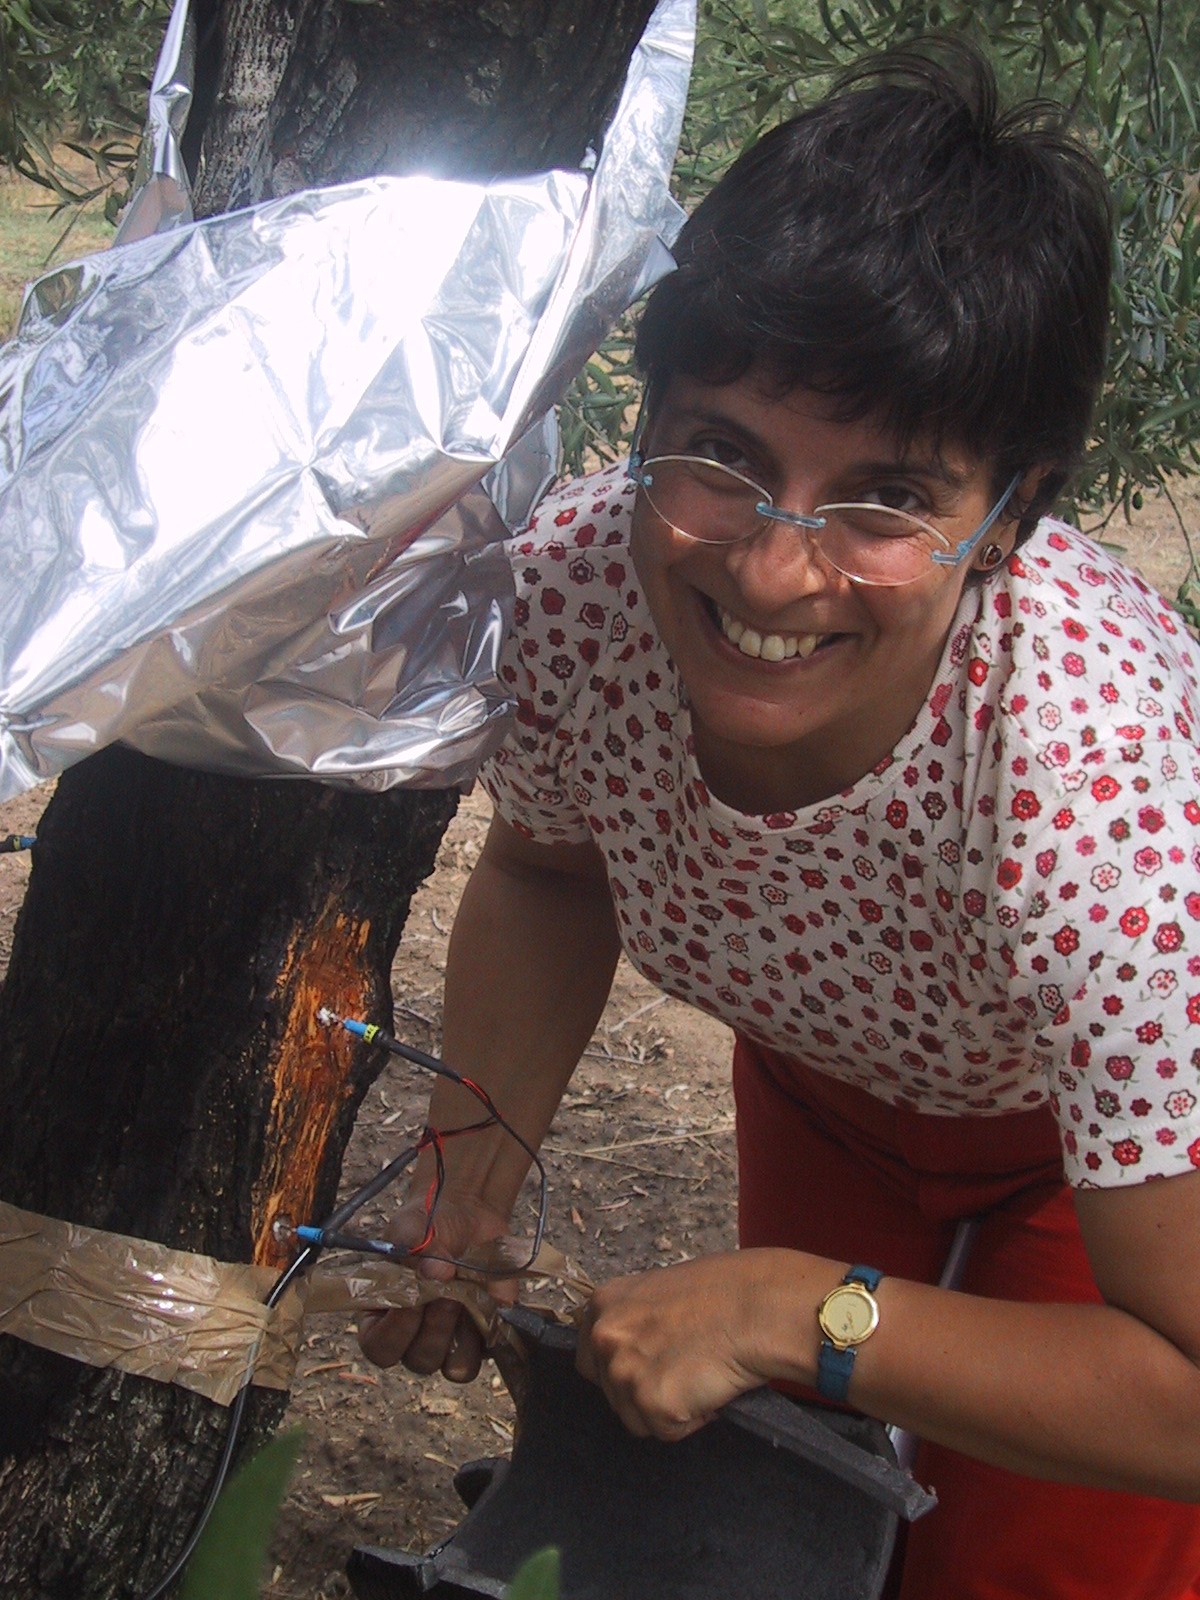
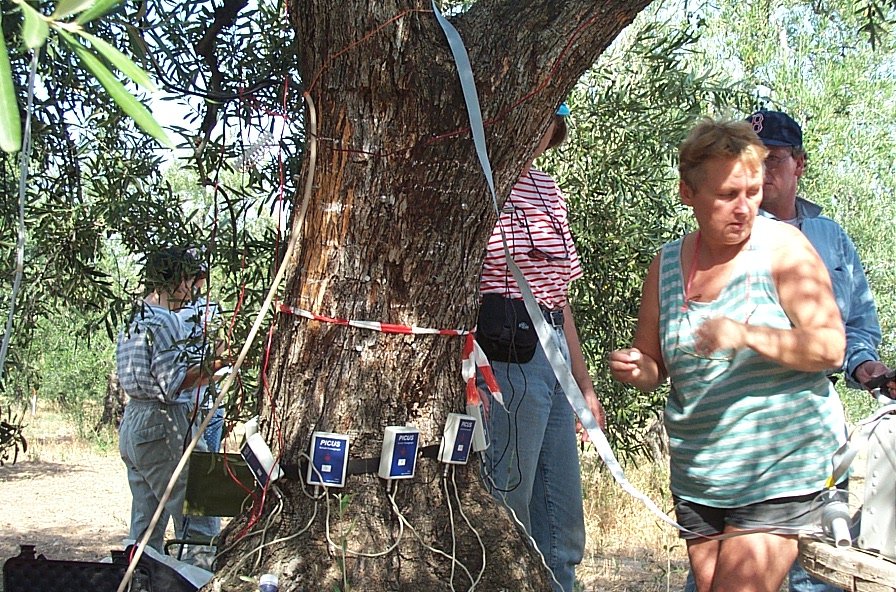
Several
techniques of sap-flow measurements were
applied by Partners 1, 5, and 7, ranging from the simpler Granier-type
sensor,
to the heat-balance gauges, and the more complex heat field deformation
technique developed by Partner 5. On some trees, all the techniques
were
applied concurrently, in order to better understand the relative
performance of
the methods in the very complex application under study. Indeed, the
olive tree
trunks showed to be very heterogeneous and variable, as demonstrated
also by
independent techniques (reflection of elastic waves), developed by
Partner 8.
However, a remarkable similarity between probes installed on different
trees
has been noticed, and this result could be encouraging for the
application of
these methods in the real world of agricultural water management.
Analytical
information on the leaf and canopy
energy
balance were collected by Partner 4, who deployed instruments
for monitoring
leaf boundary layer conductance, soil heat flux, global radiation under
the
canopy and in open areas, air temperature and humidity and windspeed.
Thermal
images taken by ground camera of foliage kept at different
transpiration rates
(suppressed with vaseline, not altered, thoroughly wet), in connection
with
measurements of stomatal resistance provided by Partner 1, should allow
the
development of remote-sensing techniques for estimating the
(evapo)transpiration fluxes. Unfortunately, it was not possible to
acquire good
Landsat images for the IOP because of poor weather at the time of the
satellite
pass (see below). These would have been needed for a full testing of
upscaling.
Strong
effort has been put on the geometrical and
biometrical characterization of the olive grove. This activity, lead in the
field by Partner 5, has been carried out with the help of Partners 1,
4, and 7.
It provided detailed informations on canopy structure and average
foliage
density, both crucial parameters in interpreting and upscaling some of
the sap-flow
measurements.
General
micrometeorological measurements
were provided
by Partner 7, together with his subcontractor MetInform and the team of
the
MCR-Lab of the