IOP 2
INTENSIVE OBSERVATION PERIOD
June-July 2003
Rio Frio, Portugal
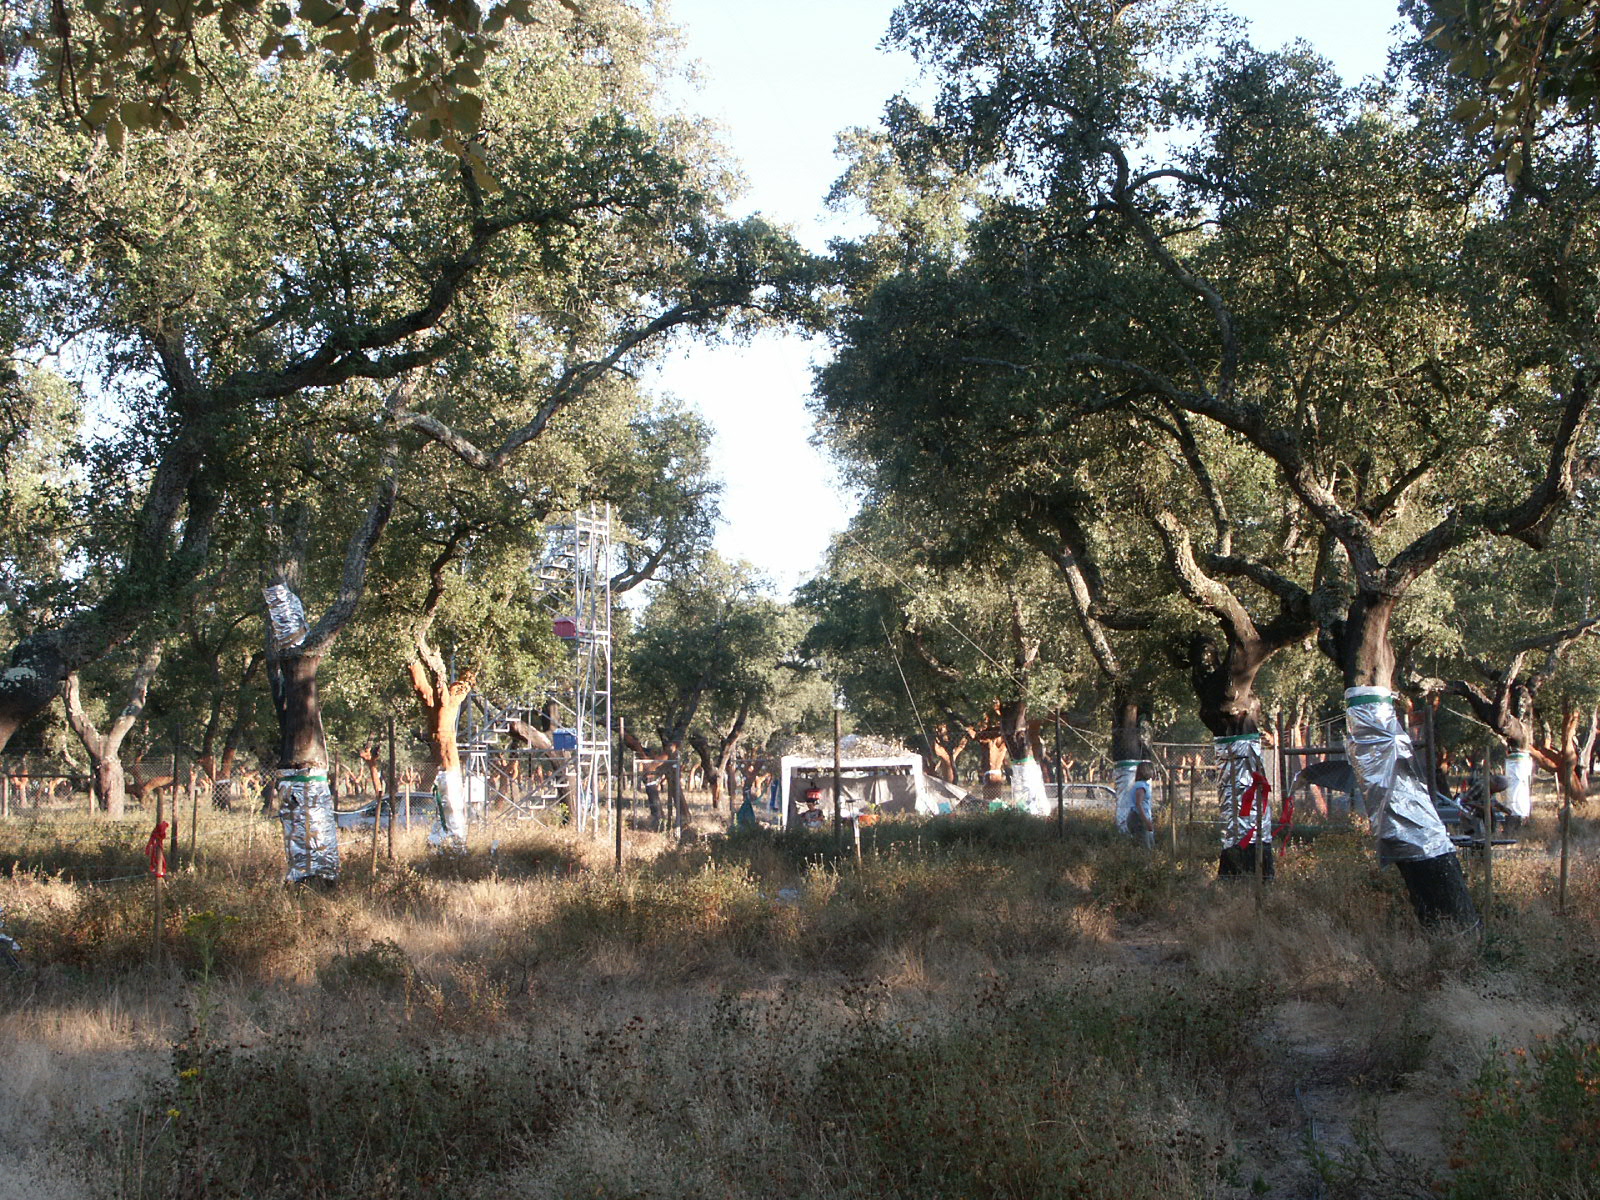
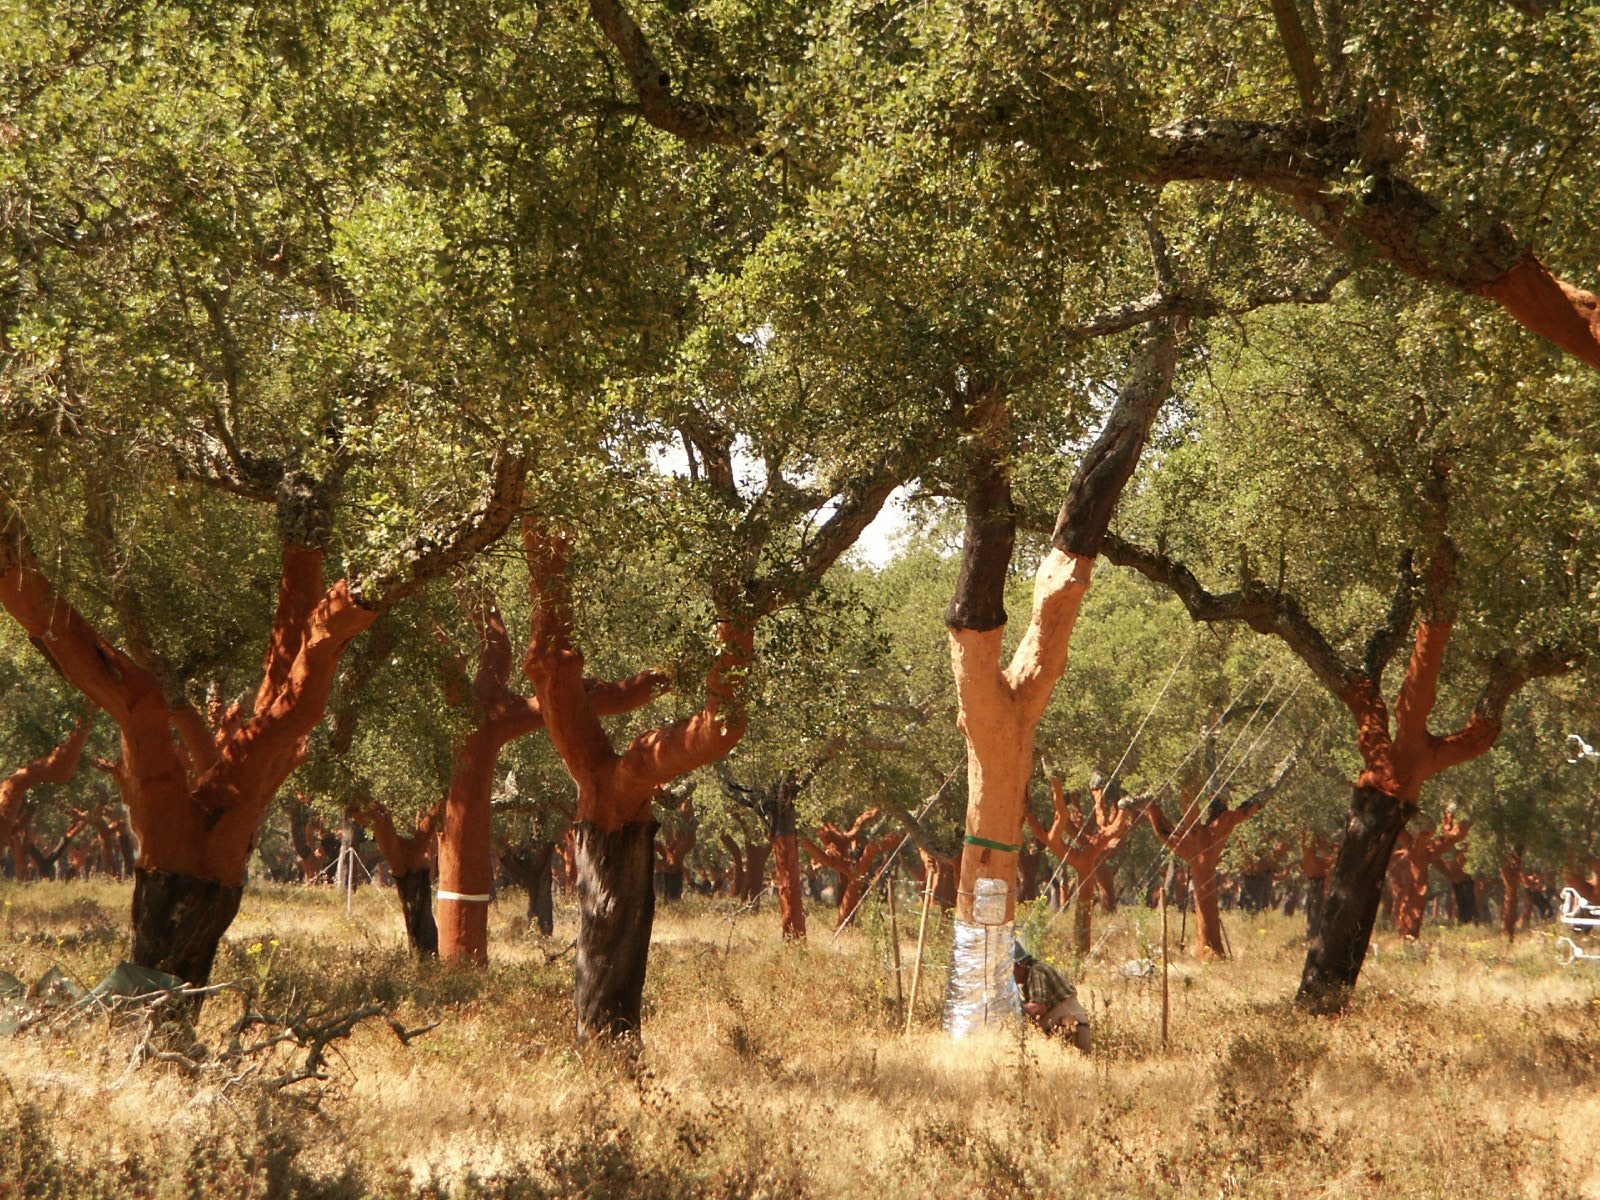
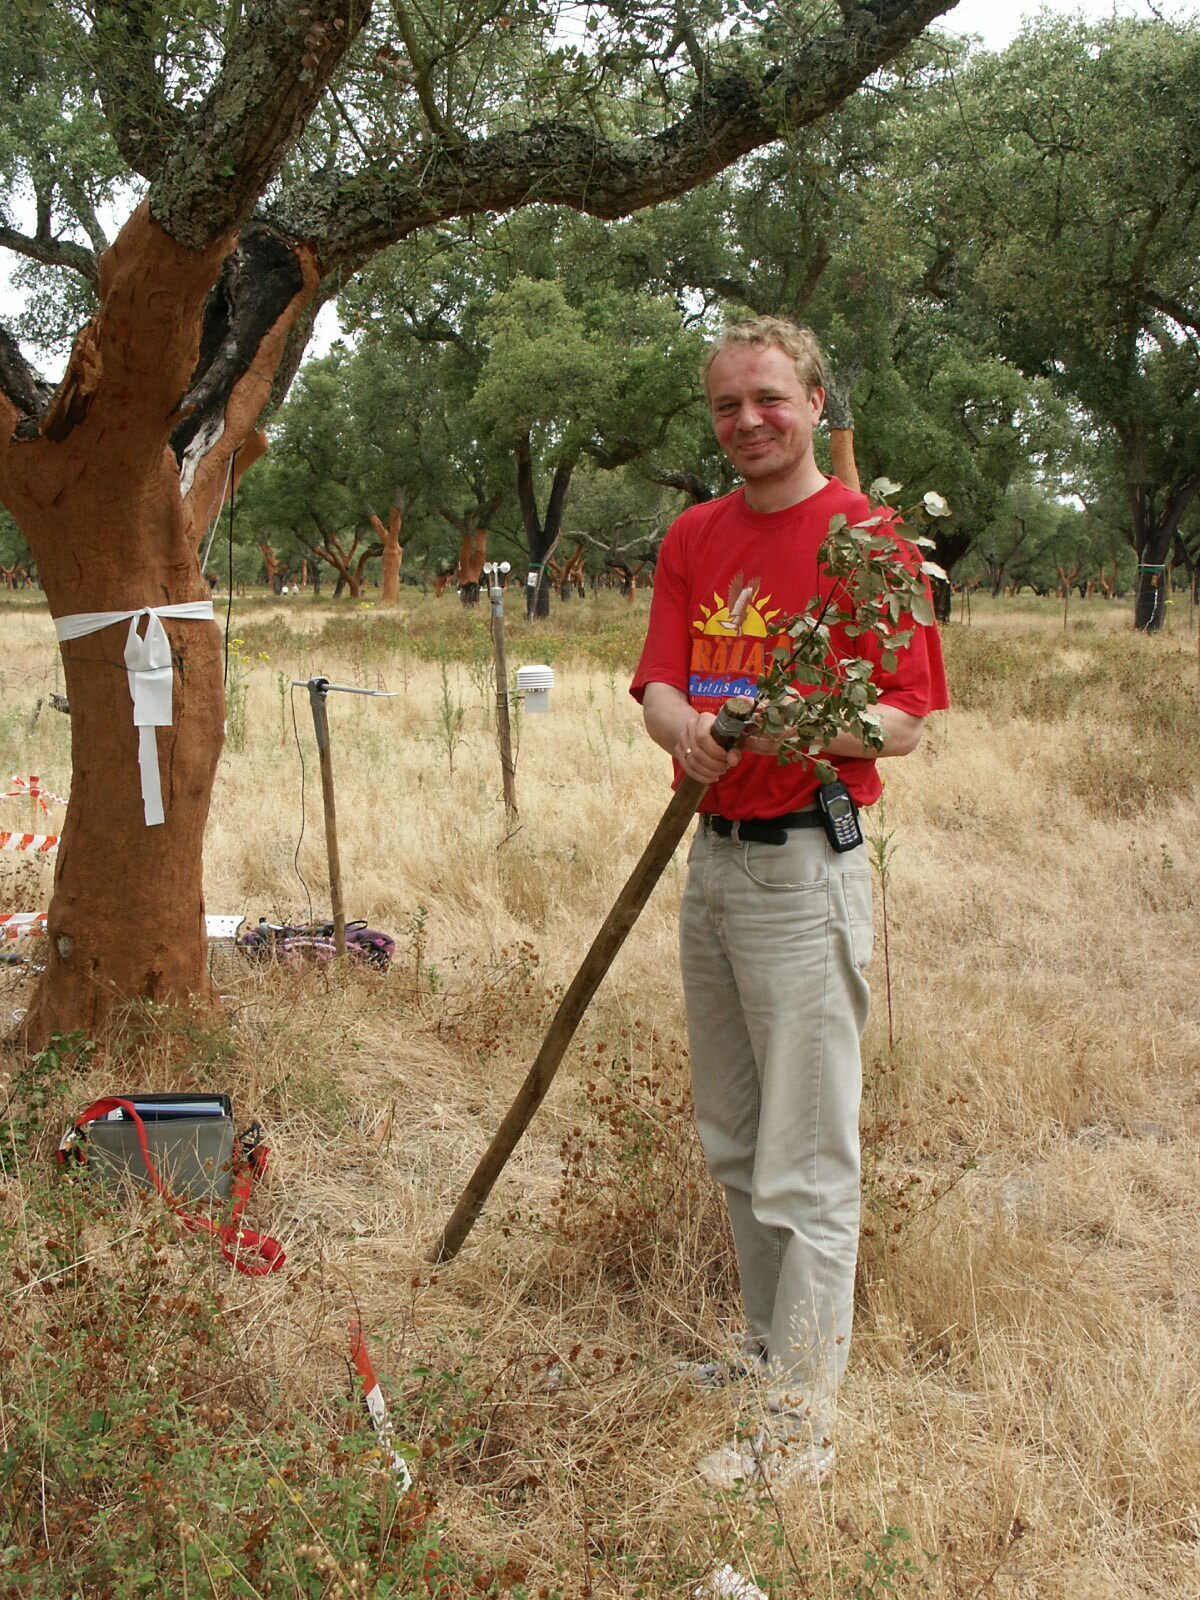
Cork oak plantation (montado) in
The main objective of IOP2 was to test the concurrent deployment and use of the various integrated techniques to study water fluxes in the different segments of the Soil-Plant-Atmosphere System including those that were developed elsewhere in the WATERUSE project, and to compare the results with those for the olive system used in the previous year (IOP1).
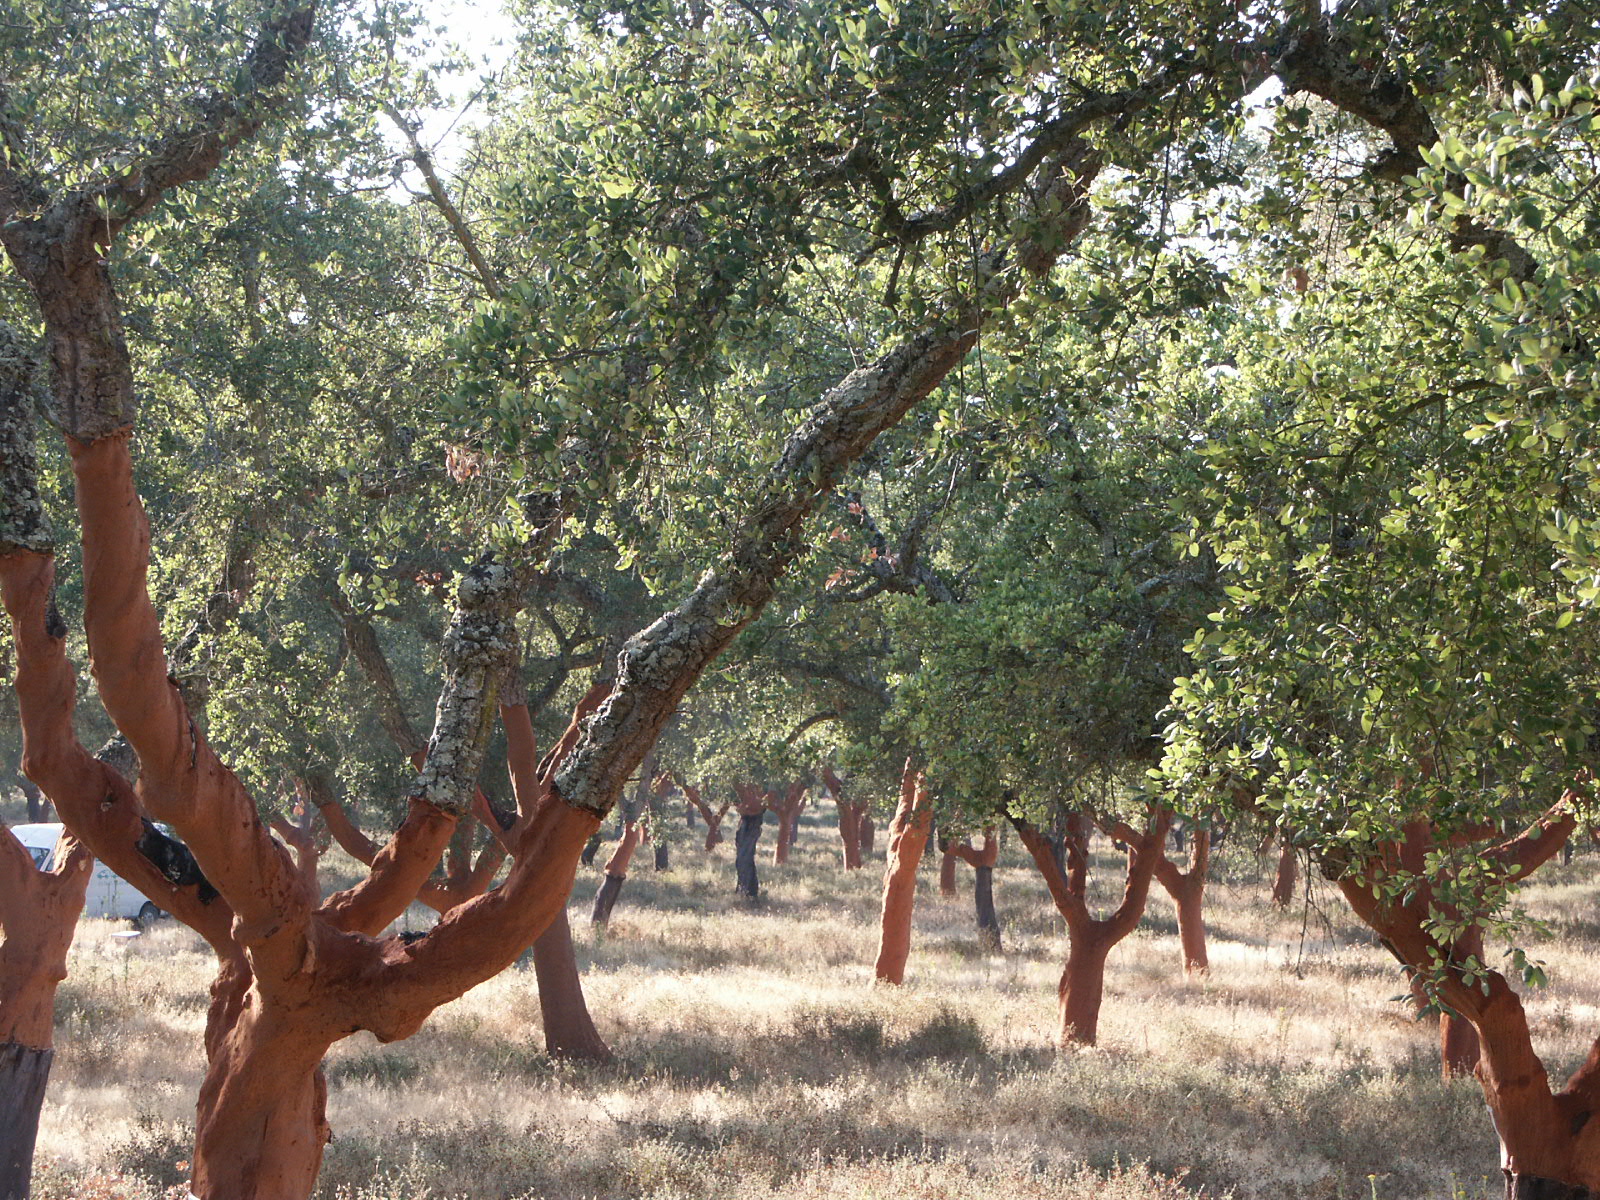
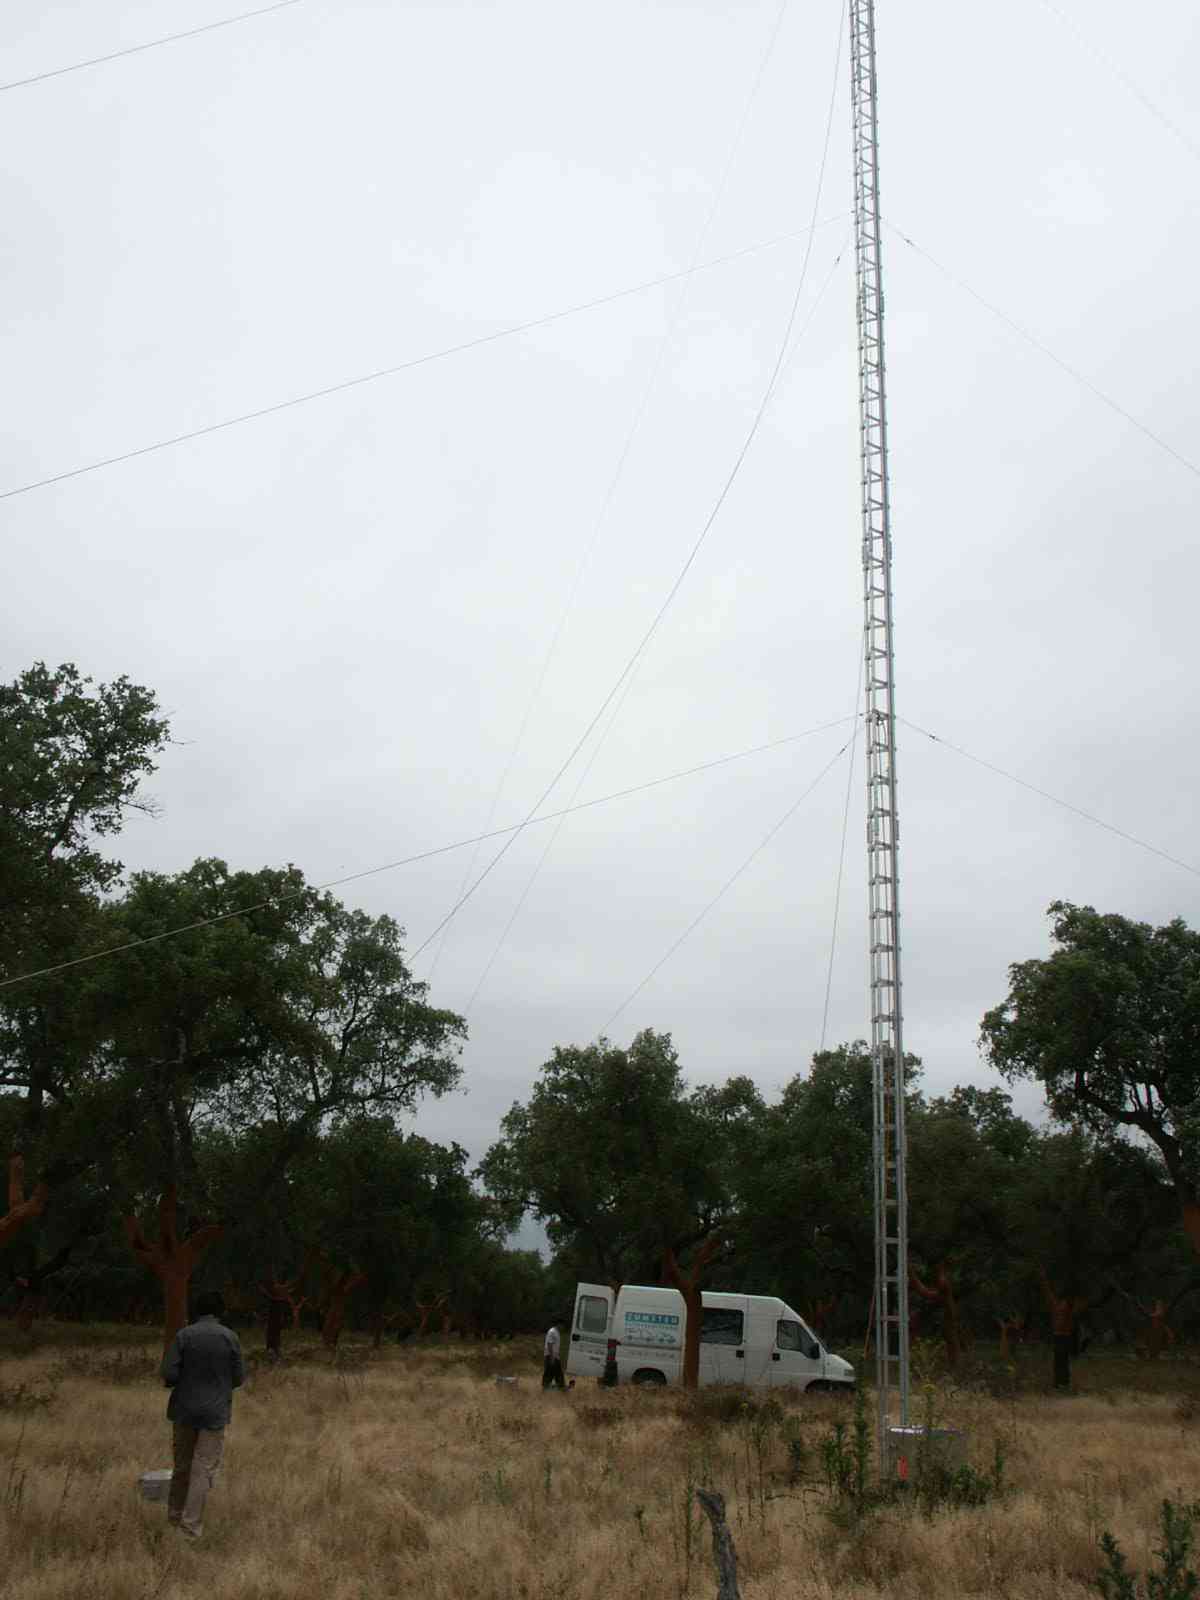
IOP2
took place from June 23rd to July 14th,
2003 in a cork oak (montado) test
site near the village of Rio Frio, between Palmela and Montijo
(38°38'N,
8°51'W; 30 m a.s.l.), low Tagus valley, about 50 km E of Lisbon,
Portugal. The
age of the trees was 80 years and they were planted in rows with 10 x
11 m
distance. The tree density was 76 trees per ha in 2001 with some
reduction in
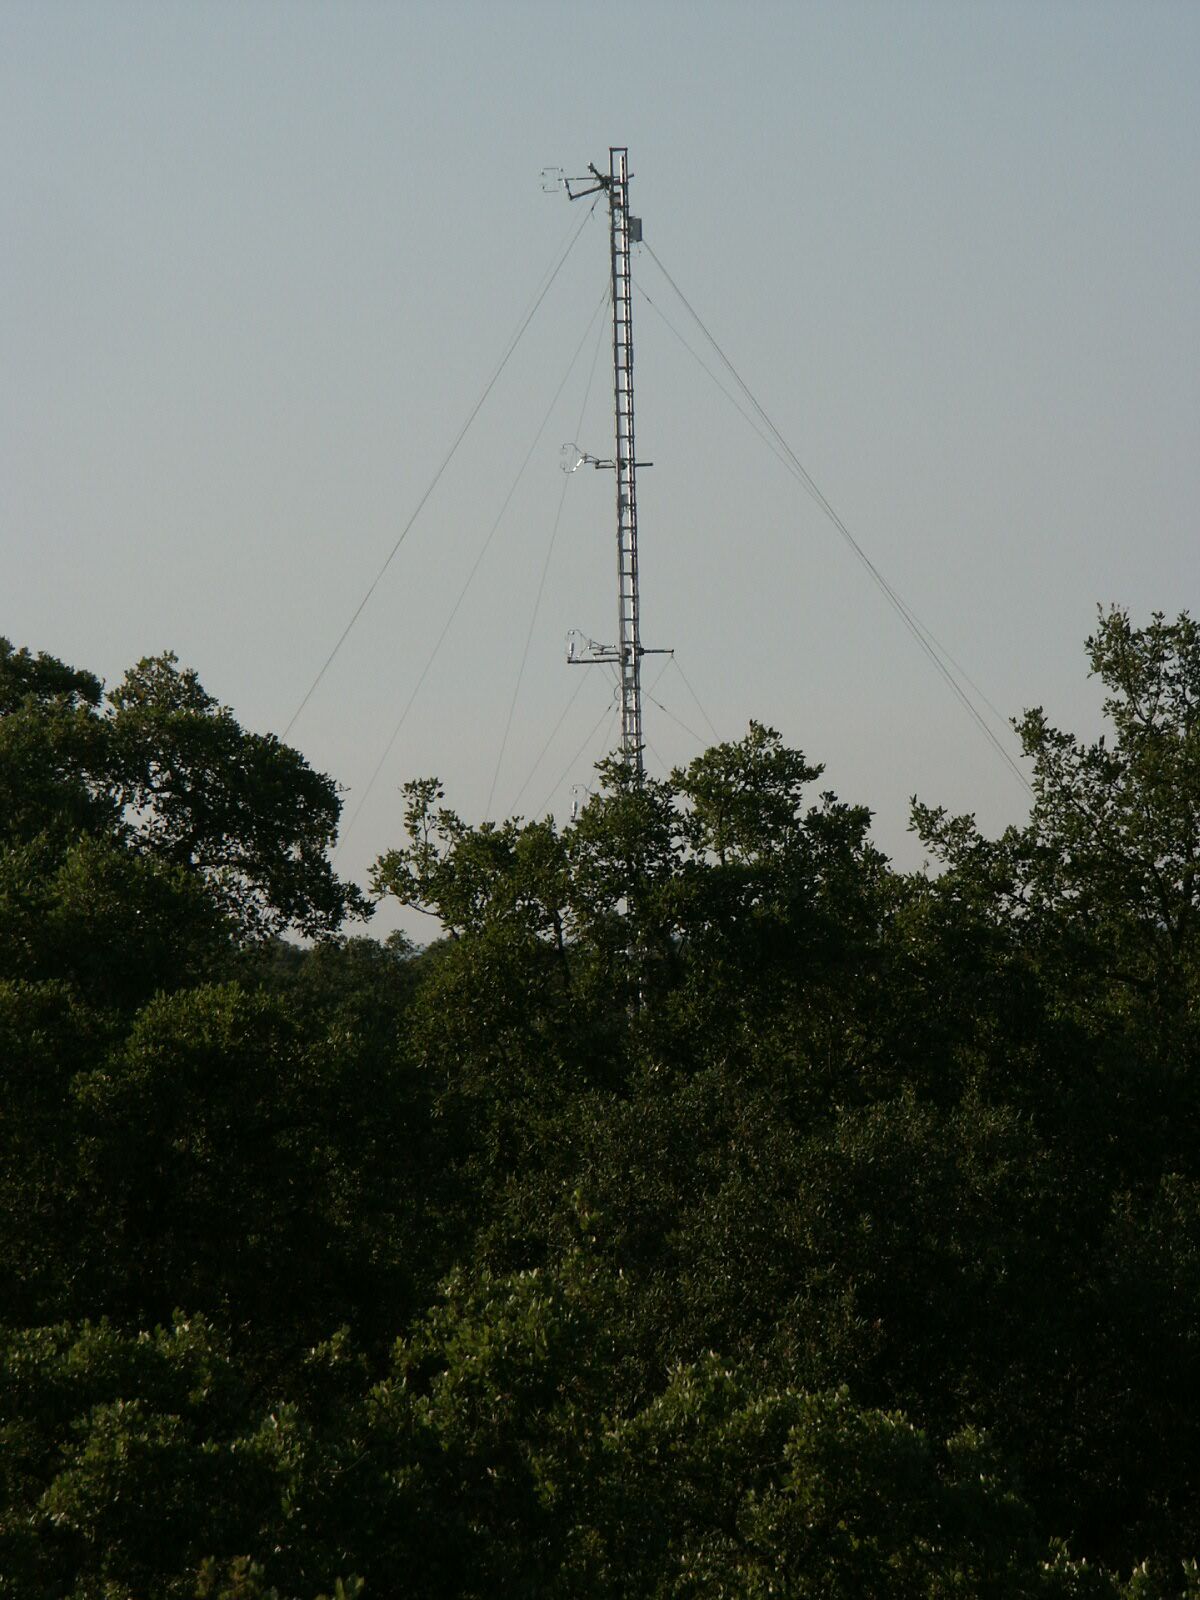
early 2003. The average canopy height was 10 m (see WP6). The
understorey was
patchy and varied between dry grass and shrubs (e.g. Cistus spp), the latter reached in average up to
0.4 m. Fetch
conditions in the main wind direction (NW) were very good, with some
variation
in tree density further upwind, and terrain was almost level.
In addition to
measurements over the short period of the IOP, longer-term measurements,
especially of meteorological conditions and fluxes, soil moisture and
sap flow
were made to determine seasonal trends. Intensive monitoring of water
content
at significant points by classical methods, was done by Partner 1,
during two
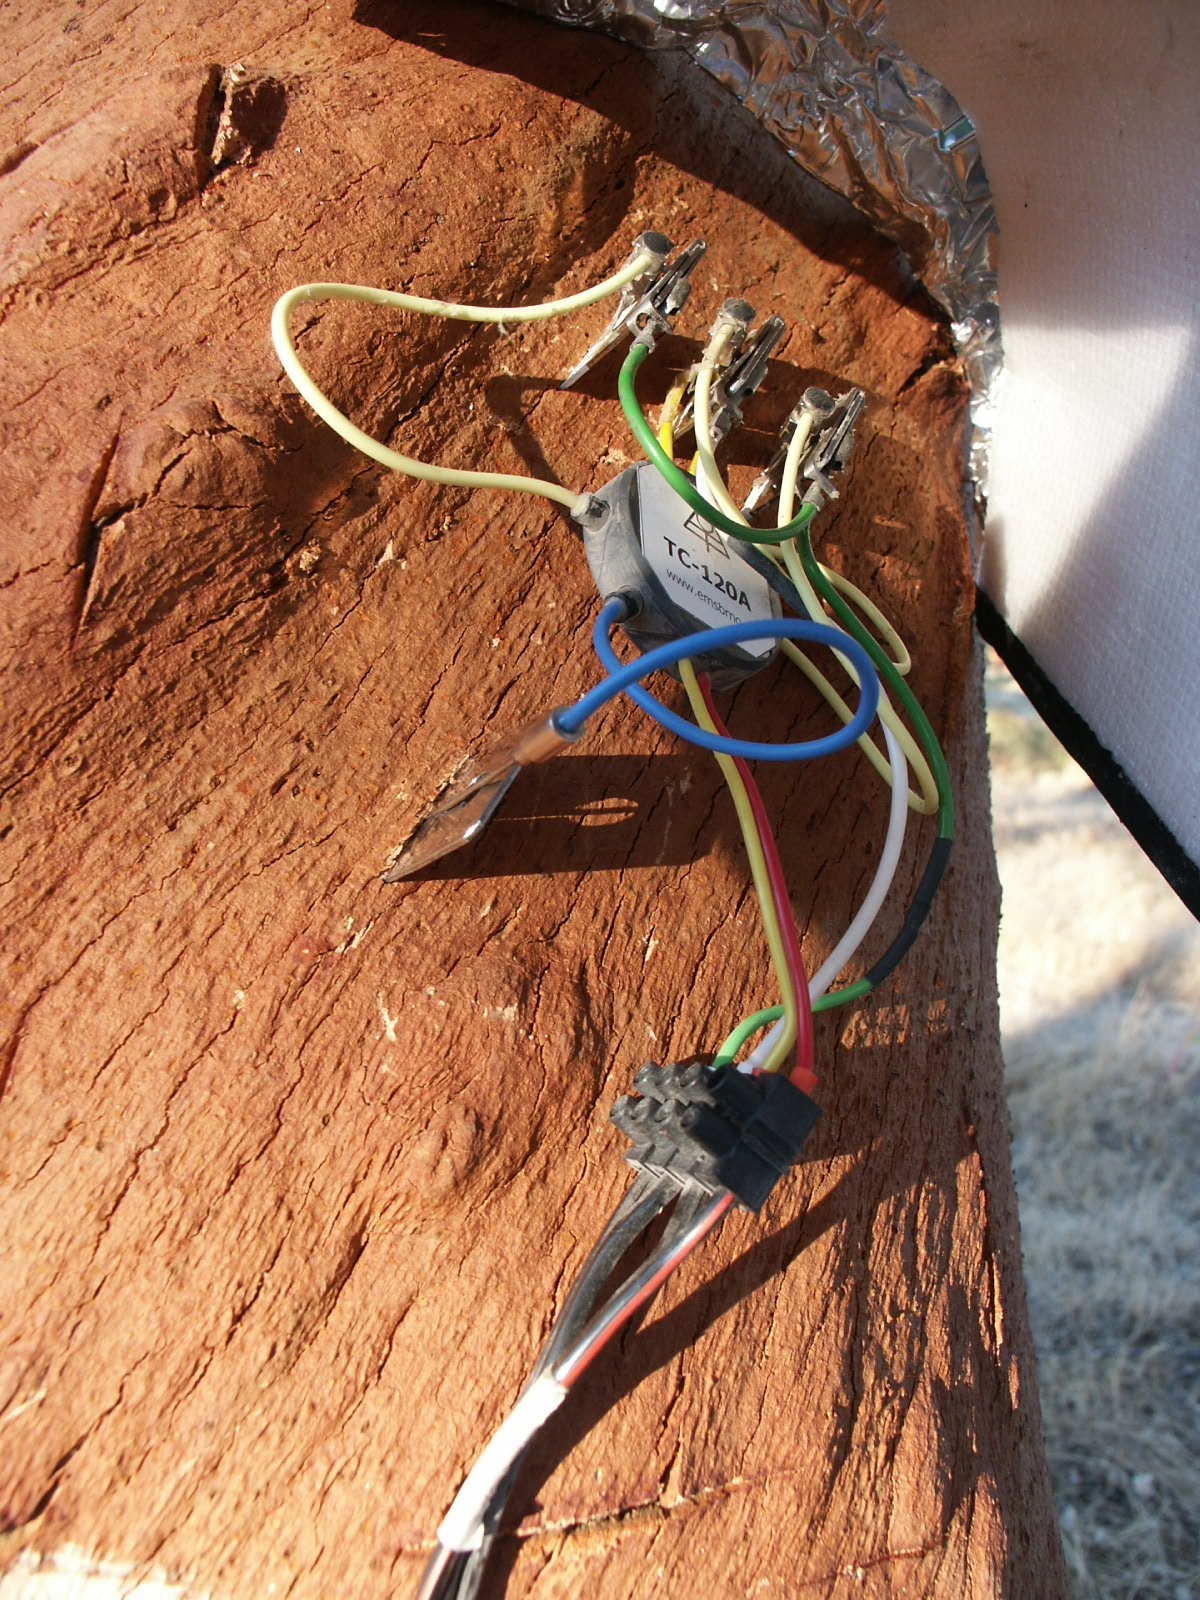
annual drying cycles (Spring-Summer). Sap-flow studies were initiated
by Partners
1 and 5 in March; these remained installed until Autumn. Additionally,
Partners
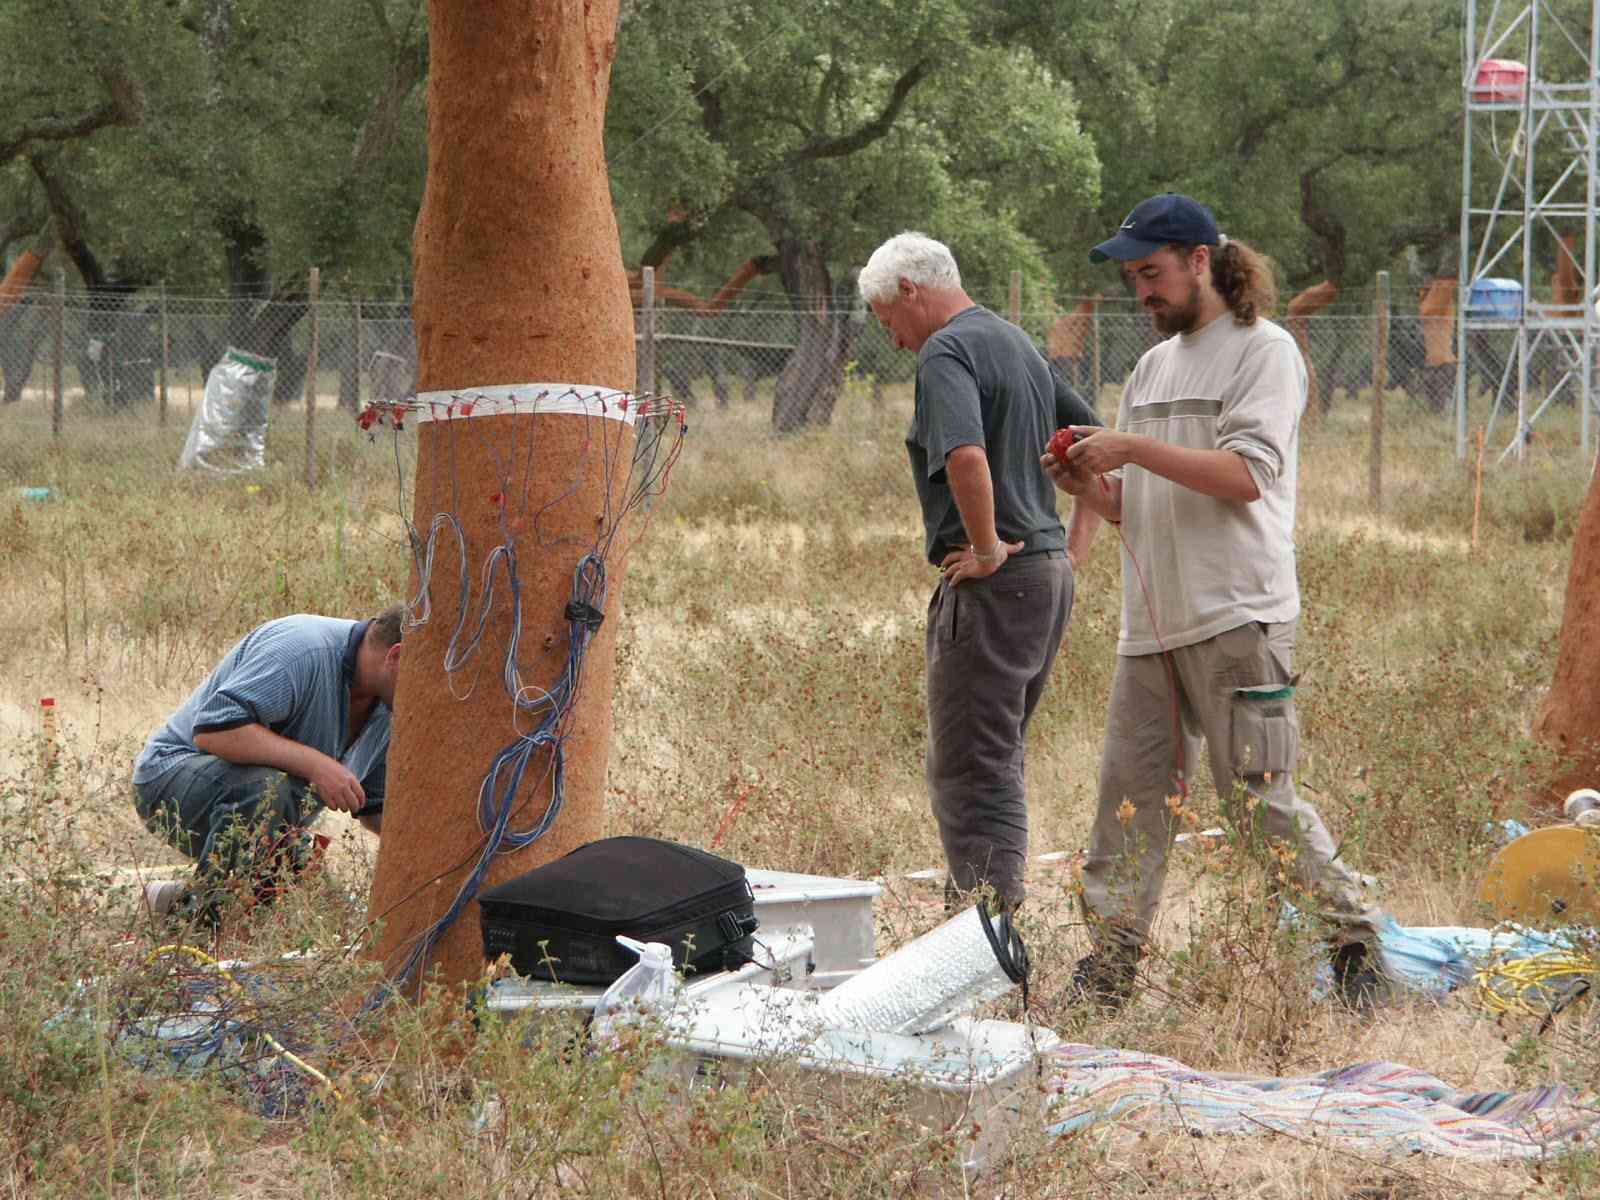
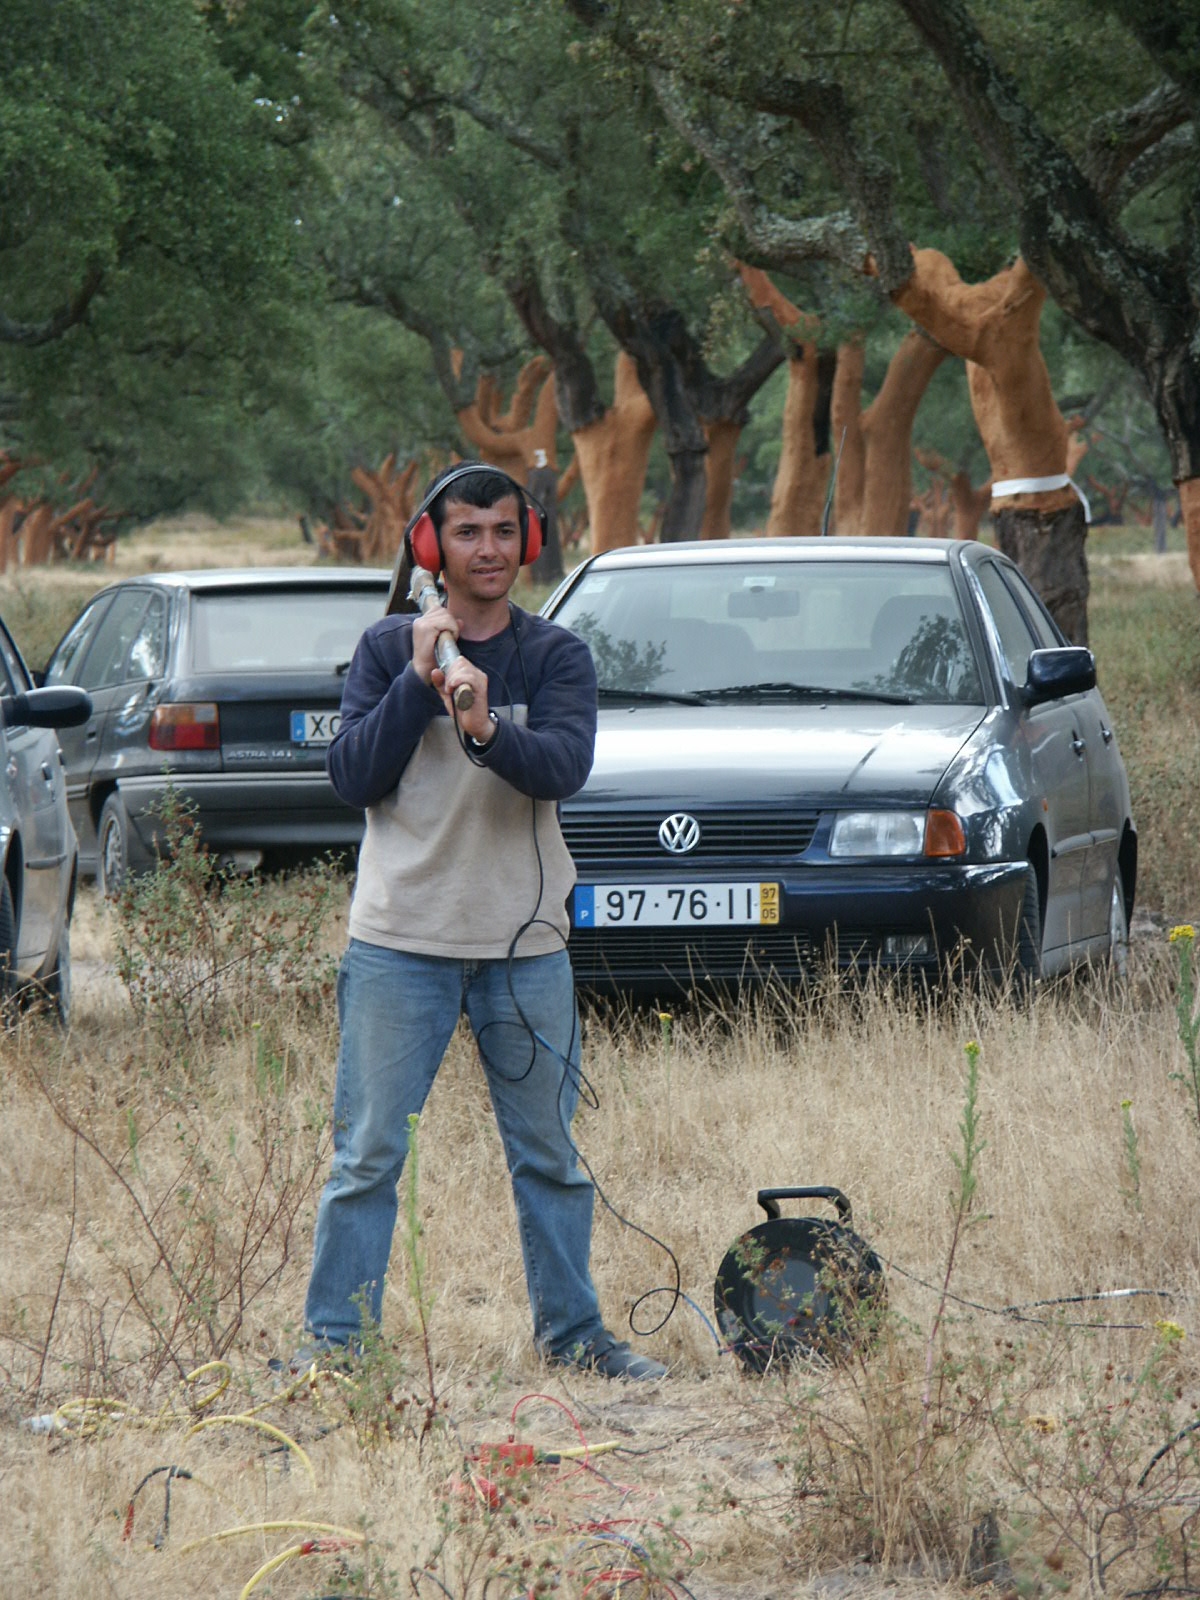
6 and 8 made measurements at Rio Frio in May. The sound tomography
device was
used to investigate the internal stem structure of cork oaks, which
were
pre-selected for sap flow measurements by the team from
The
sap-flow
studies ranged from Granier-type
sensors, to a method inspired
by the heat
balance equation and to the more complex heat field deformation technique
developed by Partner 5 (see WP2), the later with the aim of following a
possible new water stress related variable. In
fact, variables based on characteristics of sap flow index, especially
its
night/day ratio, and long-term sap flow dynamics in different xylem
layers of
tree stems have been found as possible stress indicators and potential
tool for
water resource management.
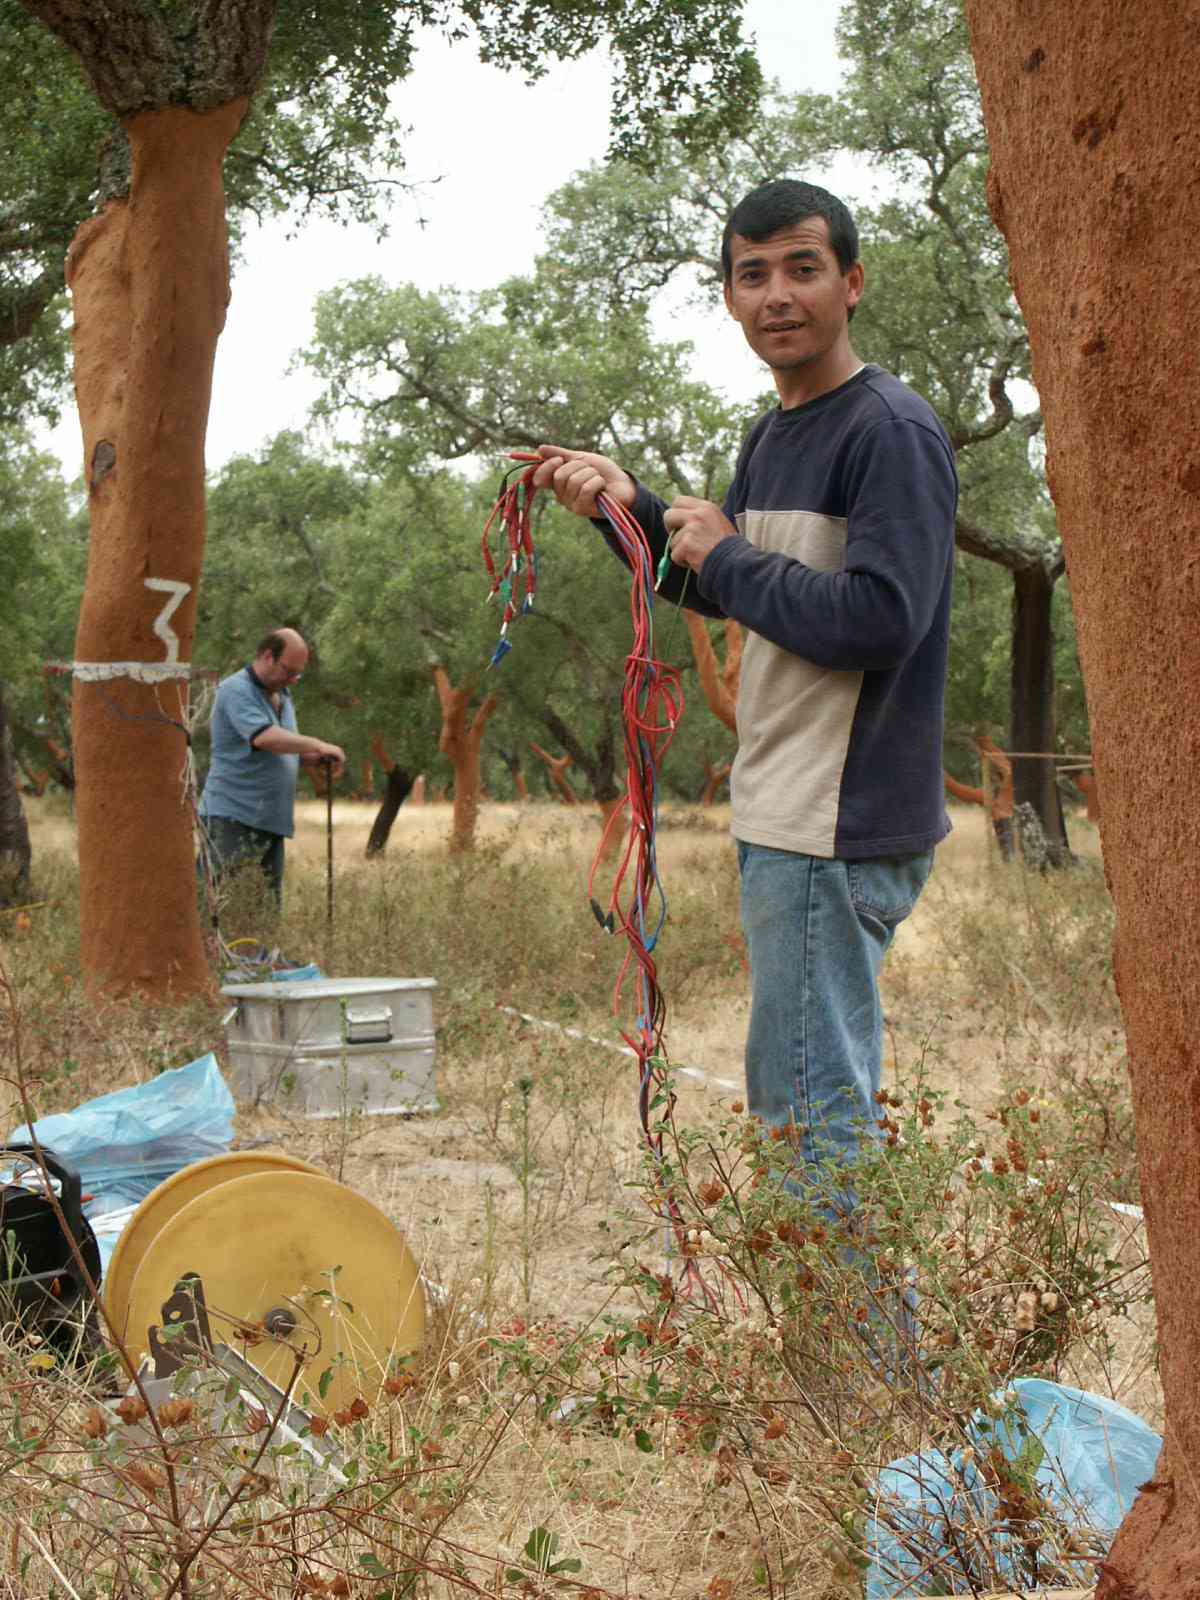
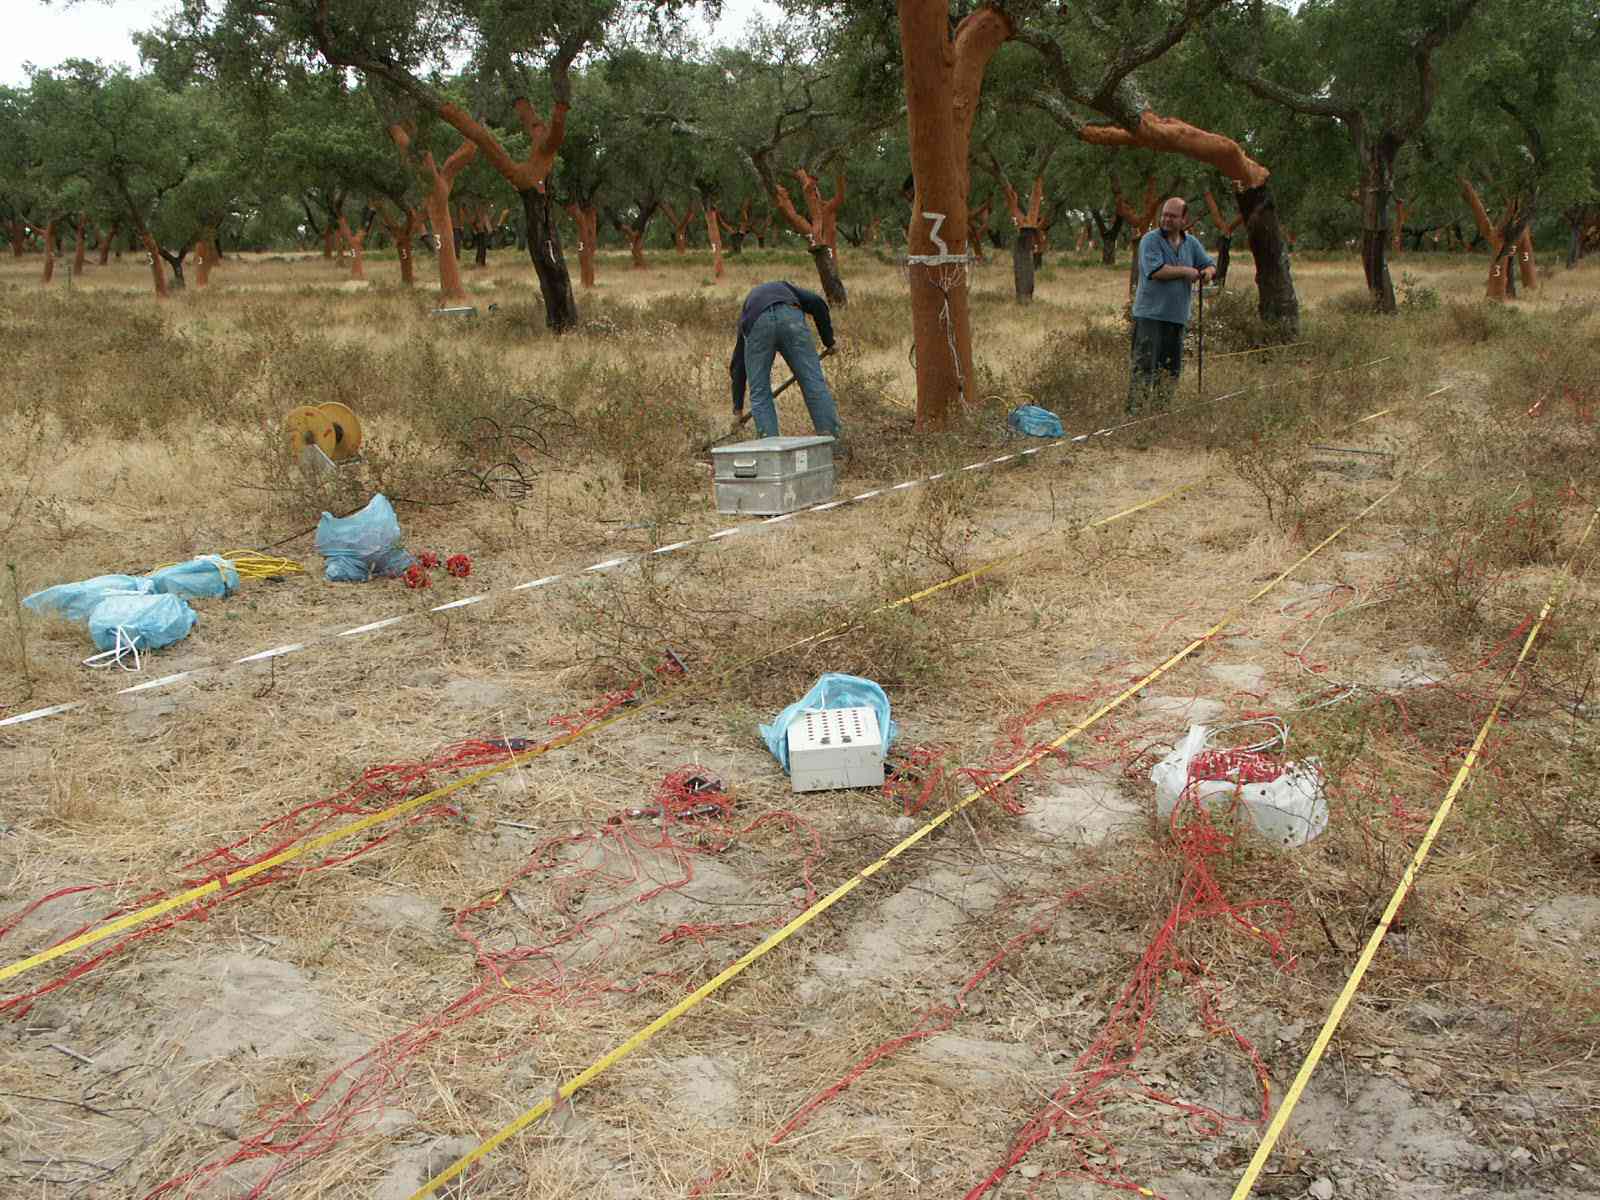
Measurements of soil physical, hydrological and
geo-pedological properties were used (Partner 1 and new tools
from WP1, WP3, Partners
6 and 8) to study the capability of the different techniques used by
Partner 6
in monitoring water uptake by the root zone at different spatial
resolutions. Partner
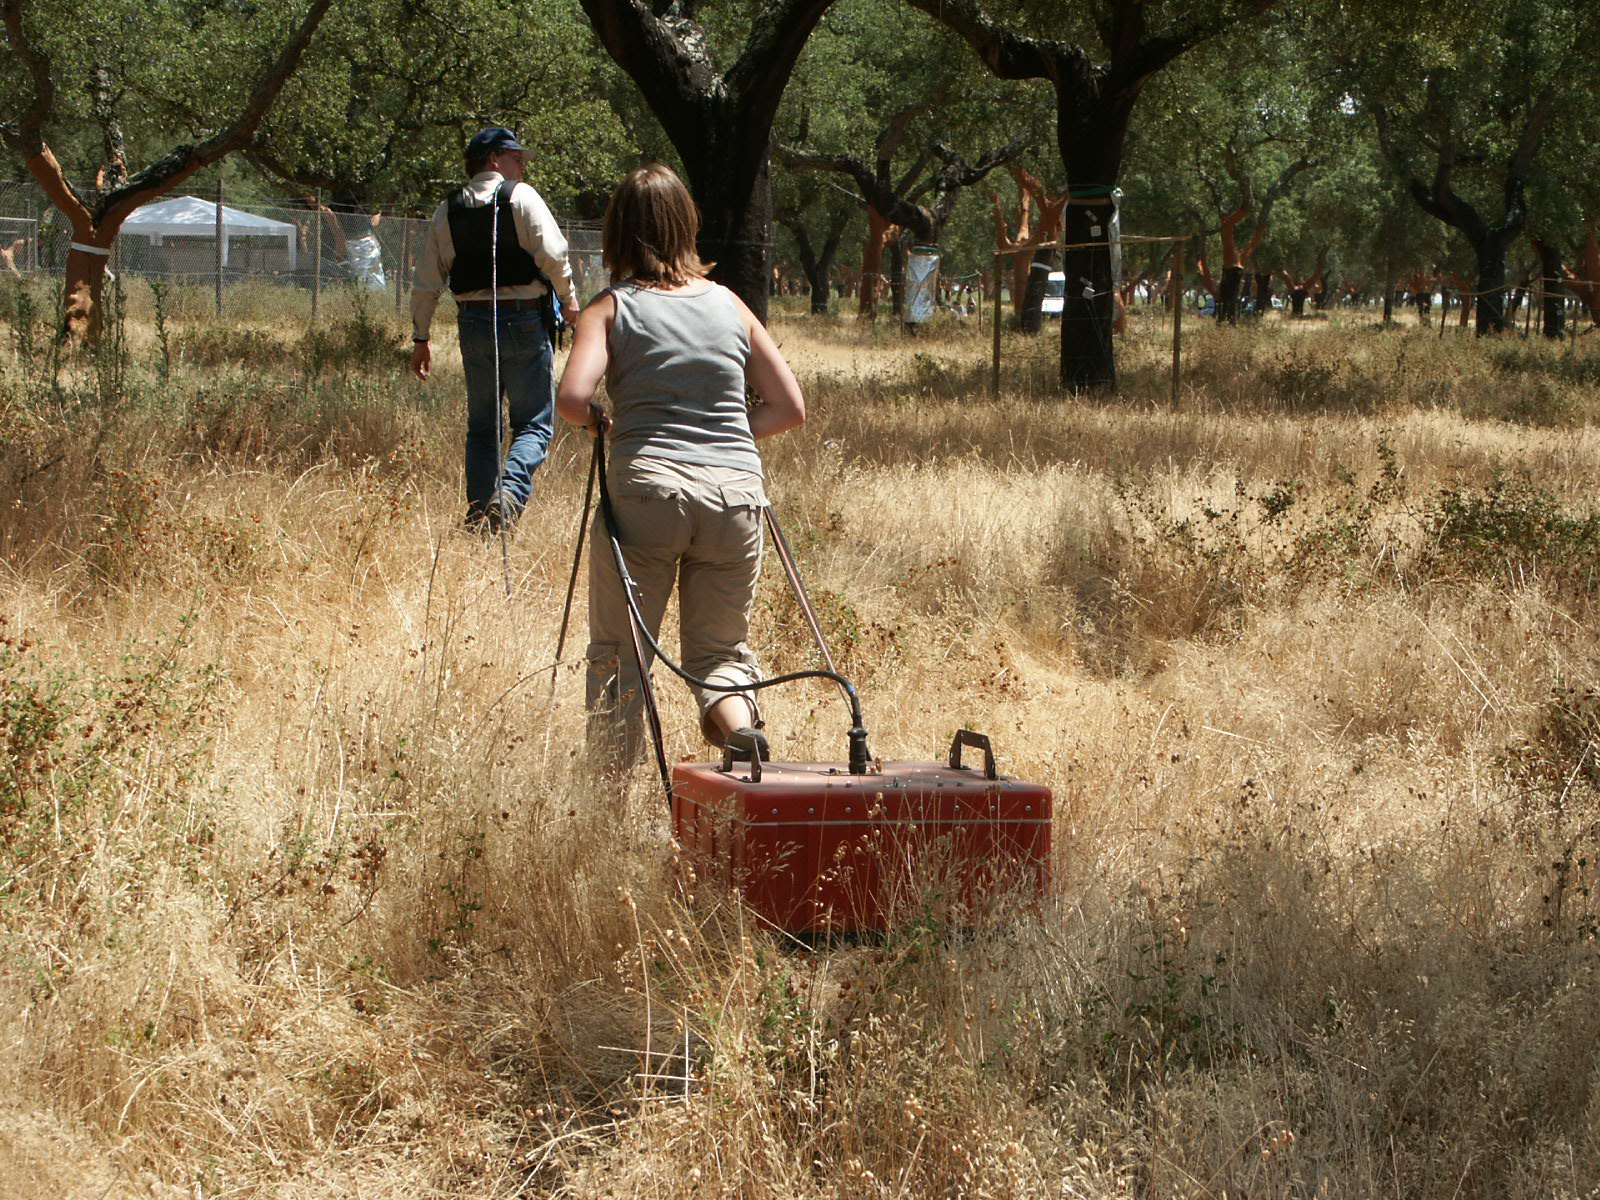
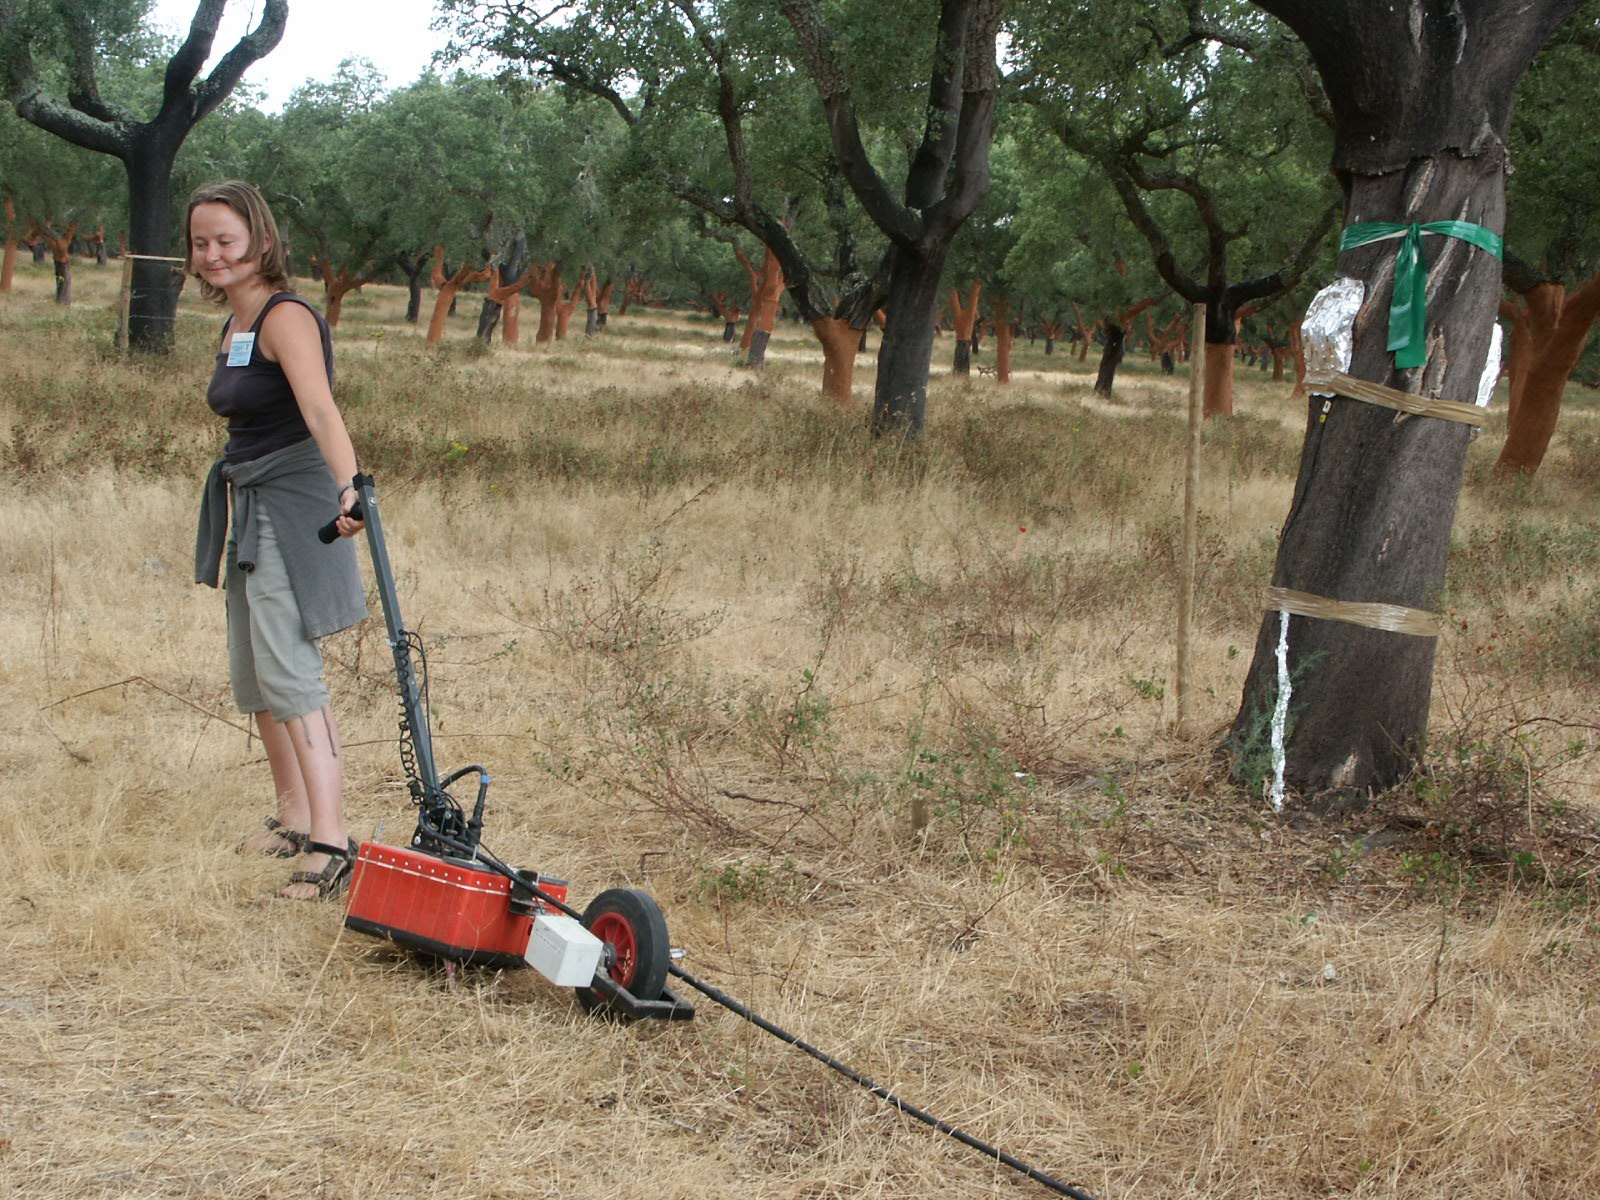
6 also studied infiltration properties of the soil. A very extensive
survey of
soil electromagnetical properties has been performed by Partner 8 in a
line (see
WP3), using the Ground Penetrating Radar technique. It showed
interesting
features of the soil structure, especially related to the vertical
profile, and
spatial (horizontal) variability, which was very useful in the
interpretation
of other soil measurements, especially geo-electrical and time-domain
reflectometry. Several trenches more then 1 m deep have been dug out.
An
opportunity to see nearby profiles of more then 5 m enabled us to
observe
directly how deep these roots could exploit the water.
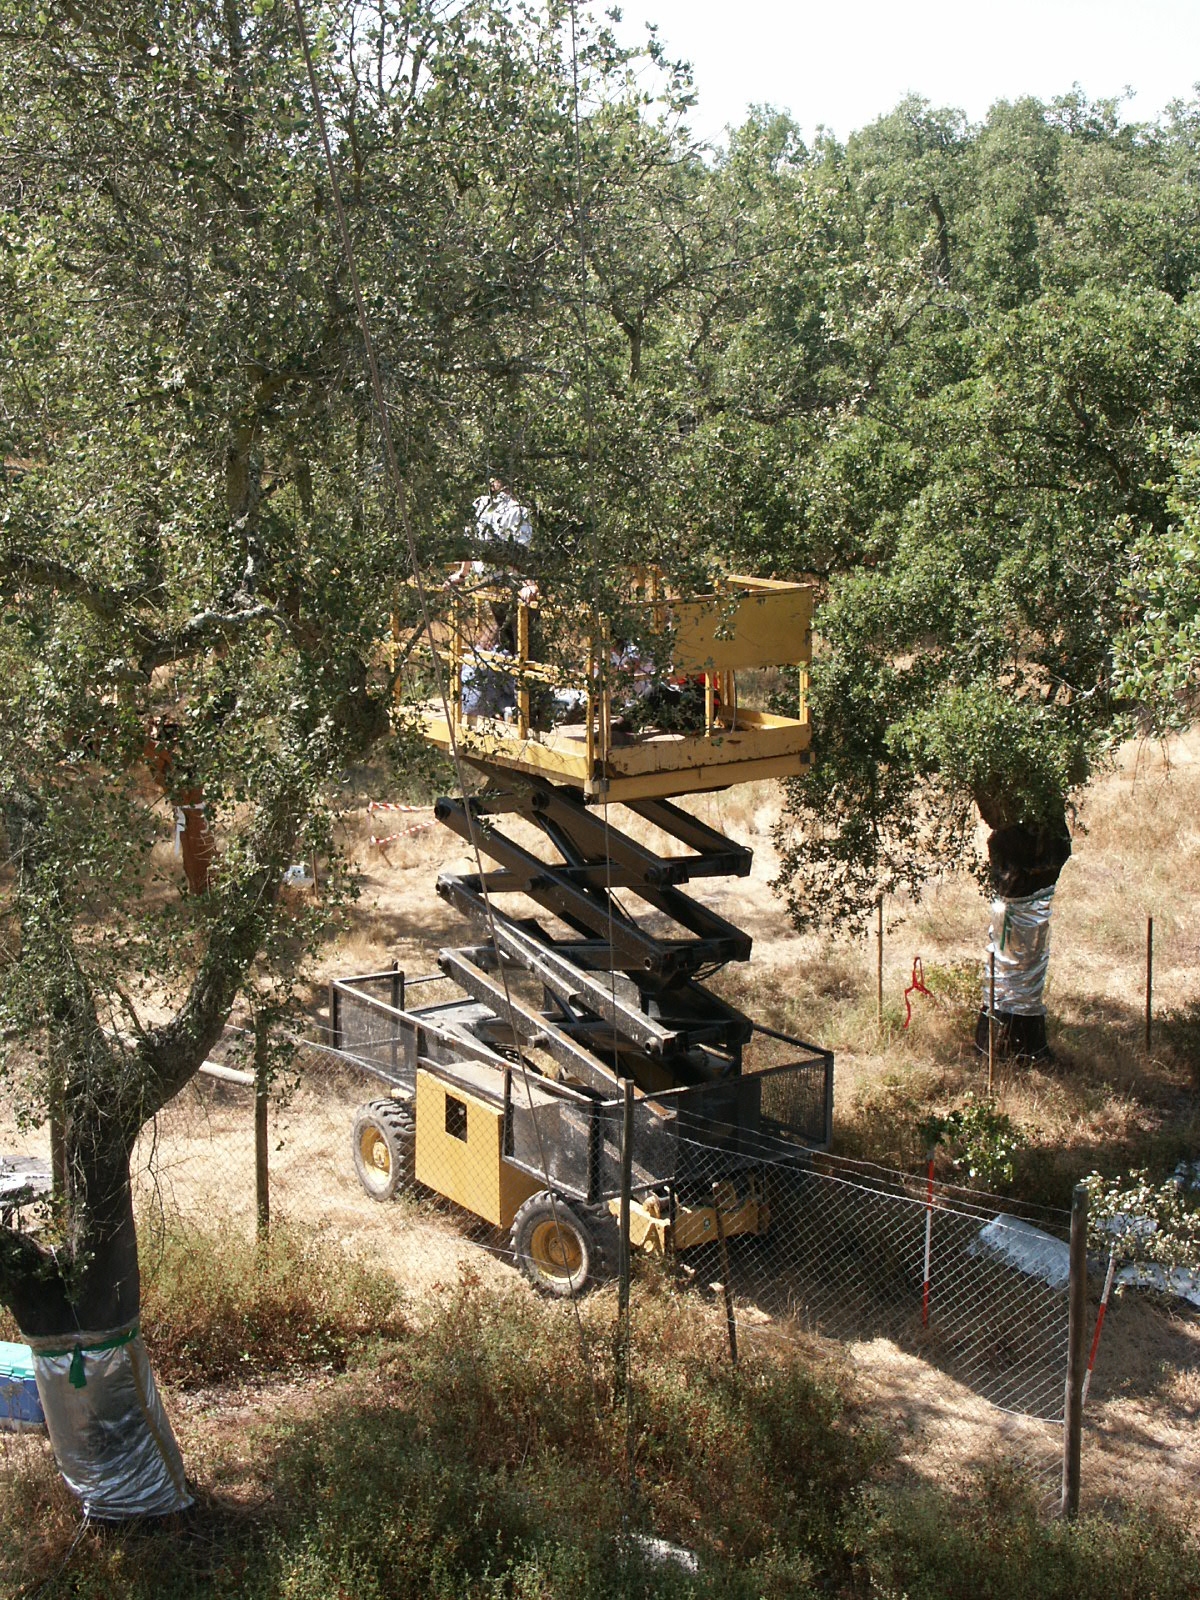
Plant canopy
structure over much of the micrometeorological footprint was
investigated by
combination of destructive and non-destructive techniques by Partners
4, 5 and
7 and later by Partner 1 using both Sunscan canopy analysers (Partner
4) and a
LiCor LAI-2000 canopy analyser (Partner 7). These surveys were based on
the
collecting radiation transmittance values under the tree canopy on a
regular
grids (e.g. 2 m ´ 2 m), in order to
study the spatial variability of tree architectural parameters in the
area
contributing to turbulent fluxes measured by the eddy covariance systems. Some further measurements on the
density and distribution of the under storey vegetation were made by
Partner 4;
these included detailed measurements of Cistus
ground cover, which involved
destructive methods, and two Cistus surveys, one using a sunscan and
the other estimating cover by eye.
General validation
of evapotranspiration (ET)
loss to the atmosphere and partitioning
between
transpiration and soil evaporation were gathered through
analytical
micrometeorological measurements, based on the eddy covariance technique and
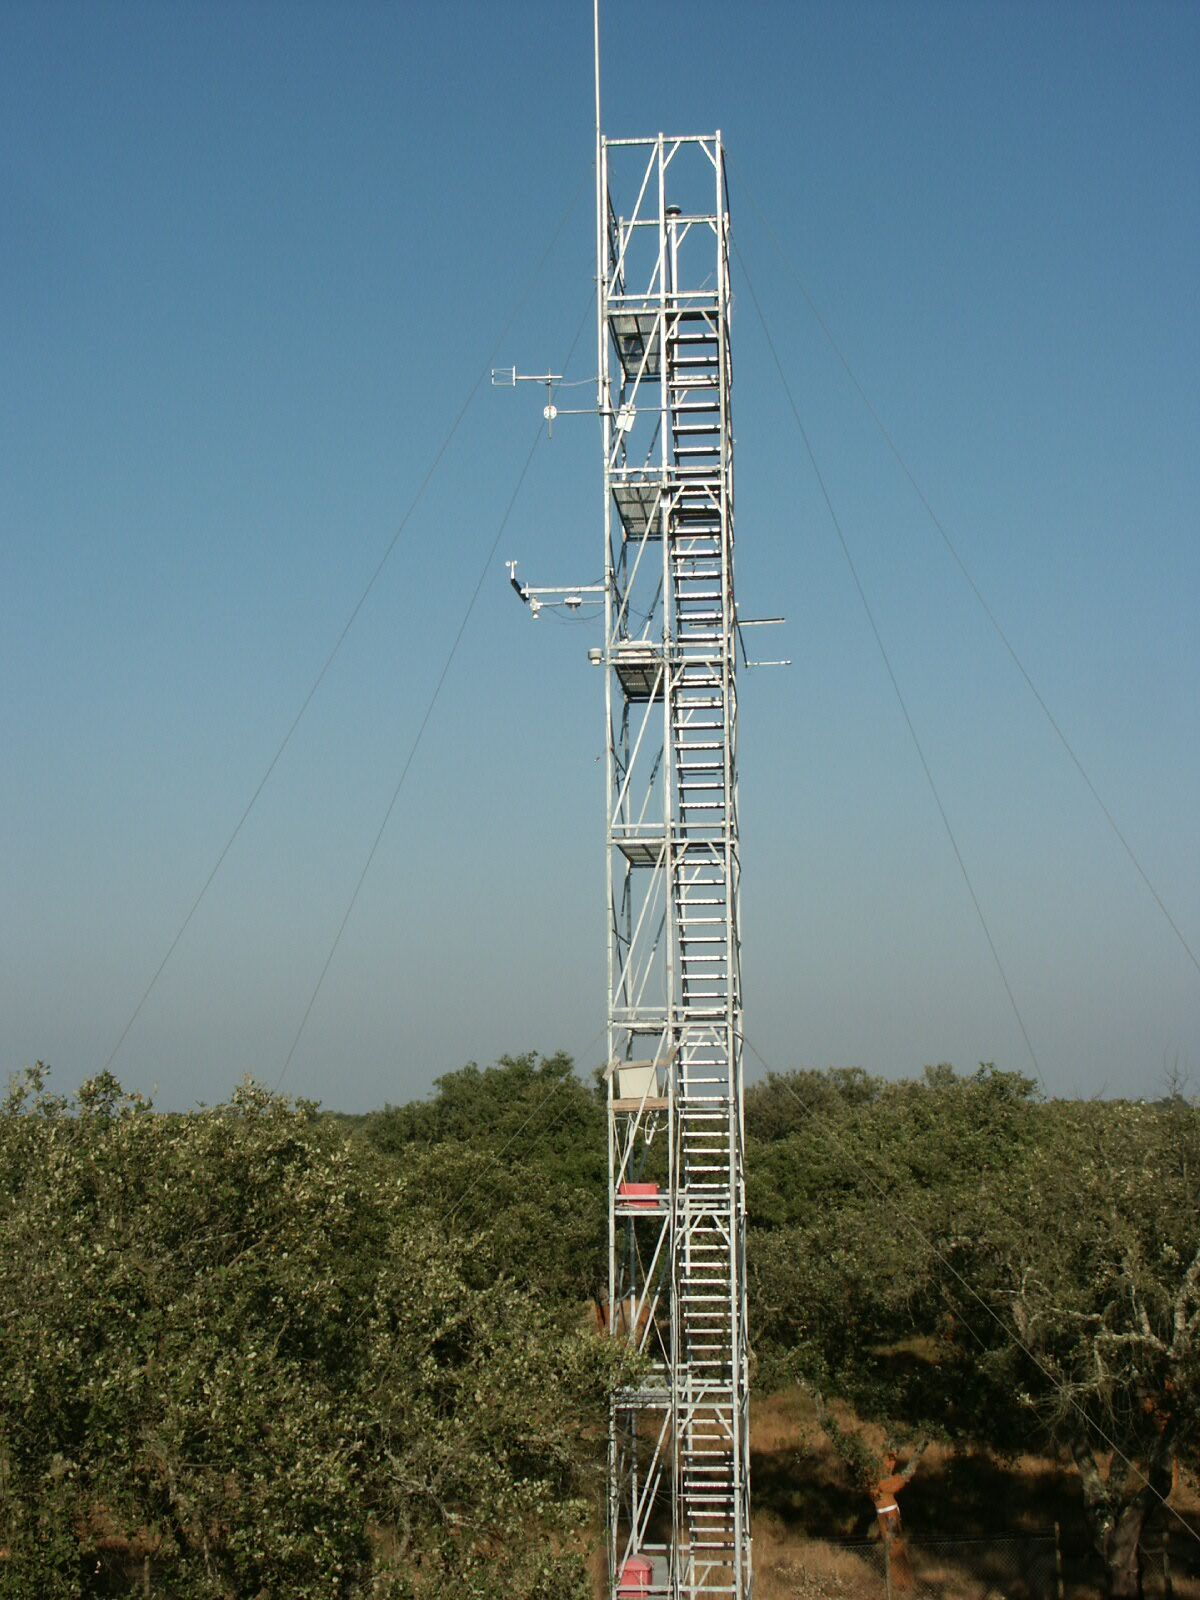
the measurements of the energy balance components. Micrometeorological
measurements, during IOP2, have been provided by Partner 7 (sensors
from Partner
1, used at seasonal scale, were installed in their tower, during 2
weeks),
together with his subcontractor MetInform and the team of the MCR-Lab
of the
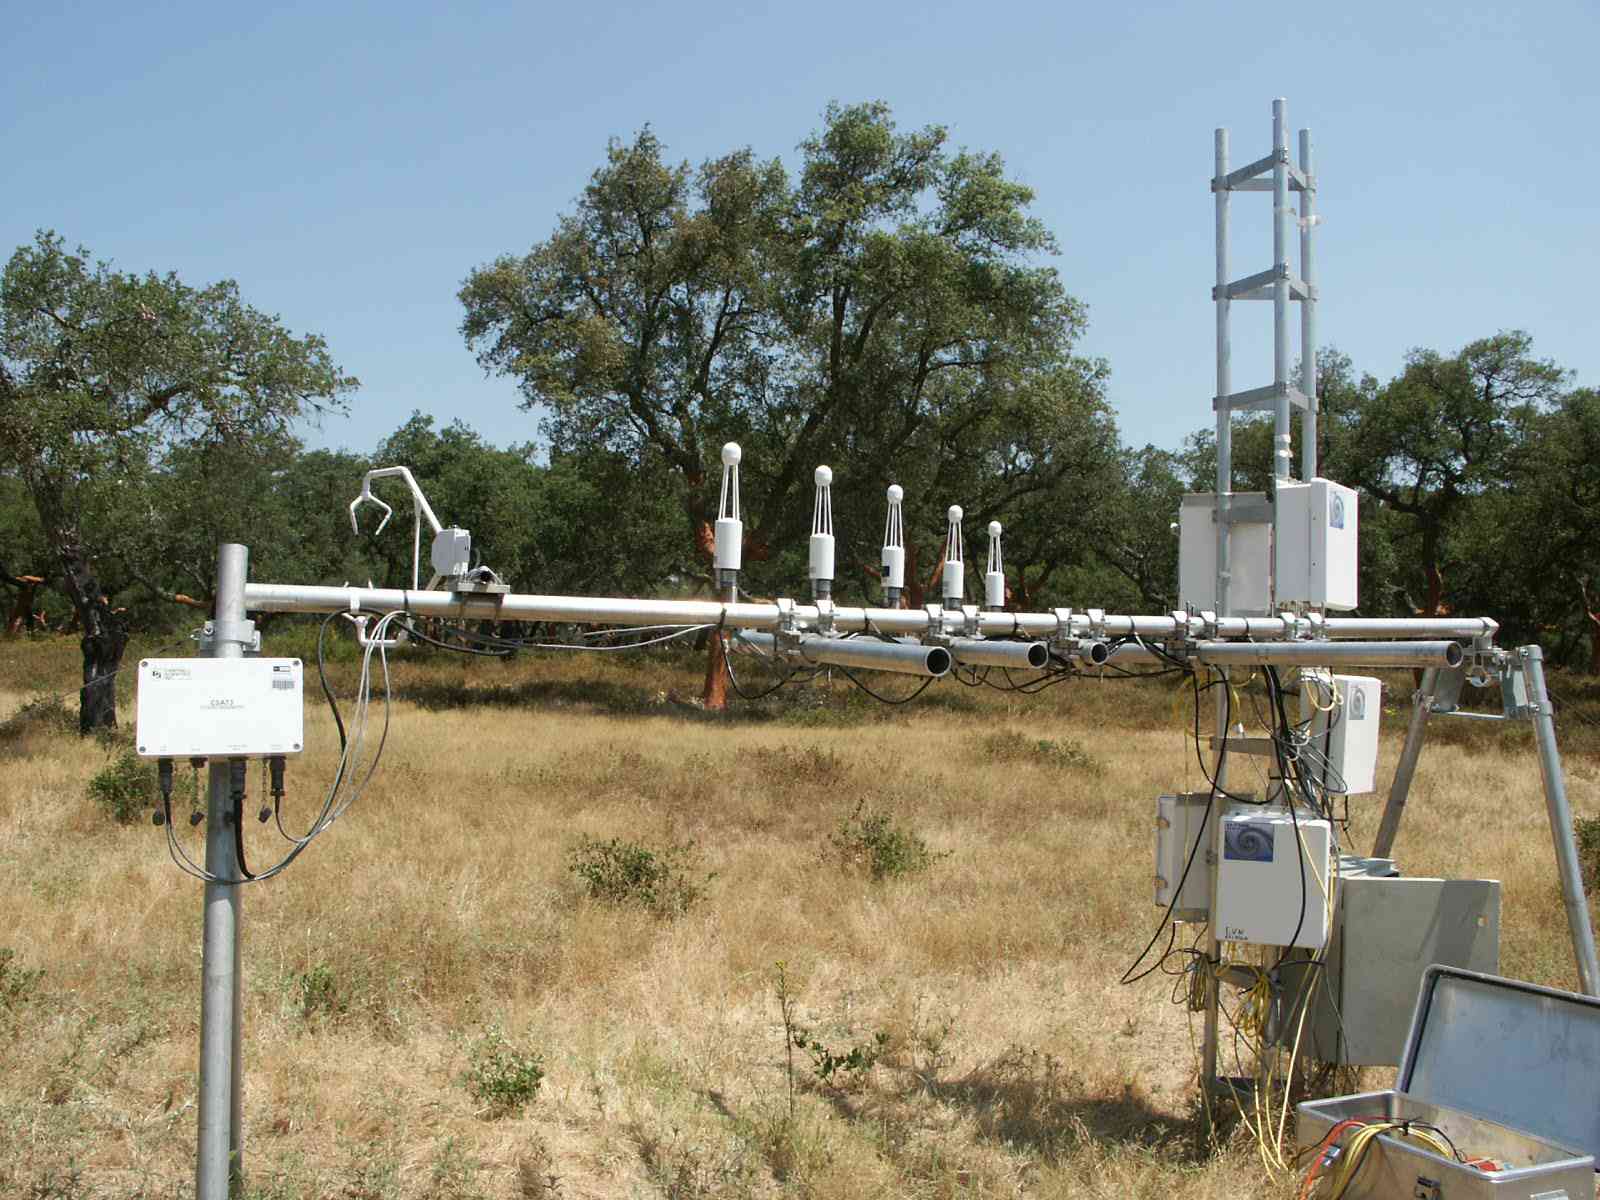
Partner 4
established a range of micrometeorological sensors within the
experiment, and
in addition mounted a series of stationary infrared temperature sensors
on the
meteorological tower to follow temperature dynamics of trees, shrubs,
grass and
soil, in both sun and shade. Boundary layer conductances in oak and
Cistus
canopies were estimated using artificial heated leaves and soil heat
flux was
estimated under oak canopy and in open grass areas. Radiation, air
temperature
and wind speed was measured at 1 m above ground. Two hand-held
infra-red
cameras were used to take infra-red images at ground level, from a
raised
platform and from a 20 m tower. Unfortunately, Landsat 7 was not
functioning
during July, so no satellite data was acquired during the field
campaign,
however, late in the project NASA eventually provided partially
corrected
Landsat data for a period close to the IOP period which are being used
for
comparative studies and will be included in the combined publication
comparing
estimates of evapotranspiration rates at different scales, which is in
preparation. All
partners
exchanged meteorological and other data needed for writing the output
publications.
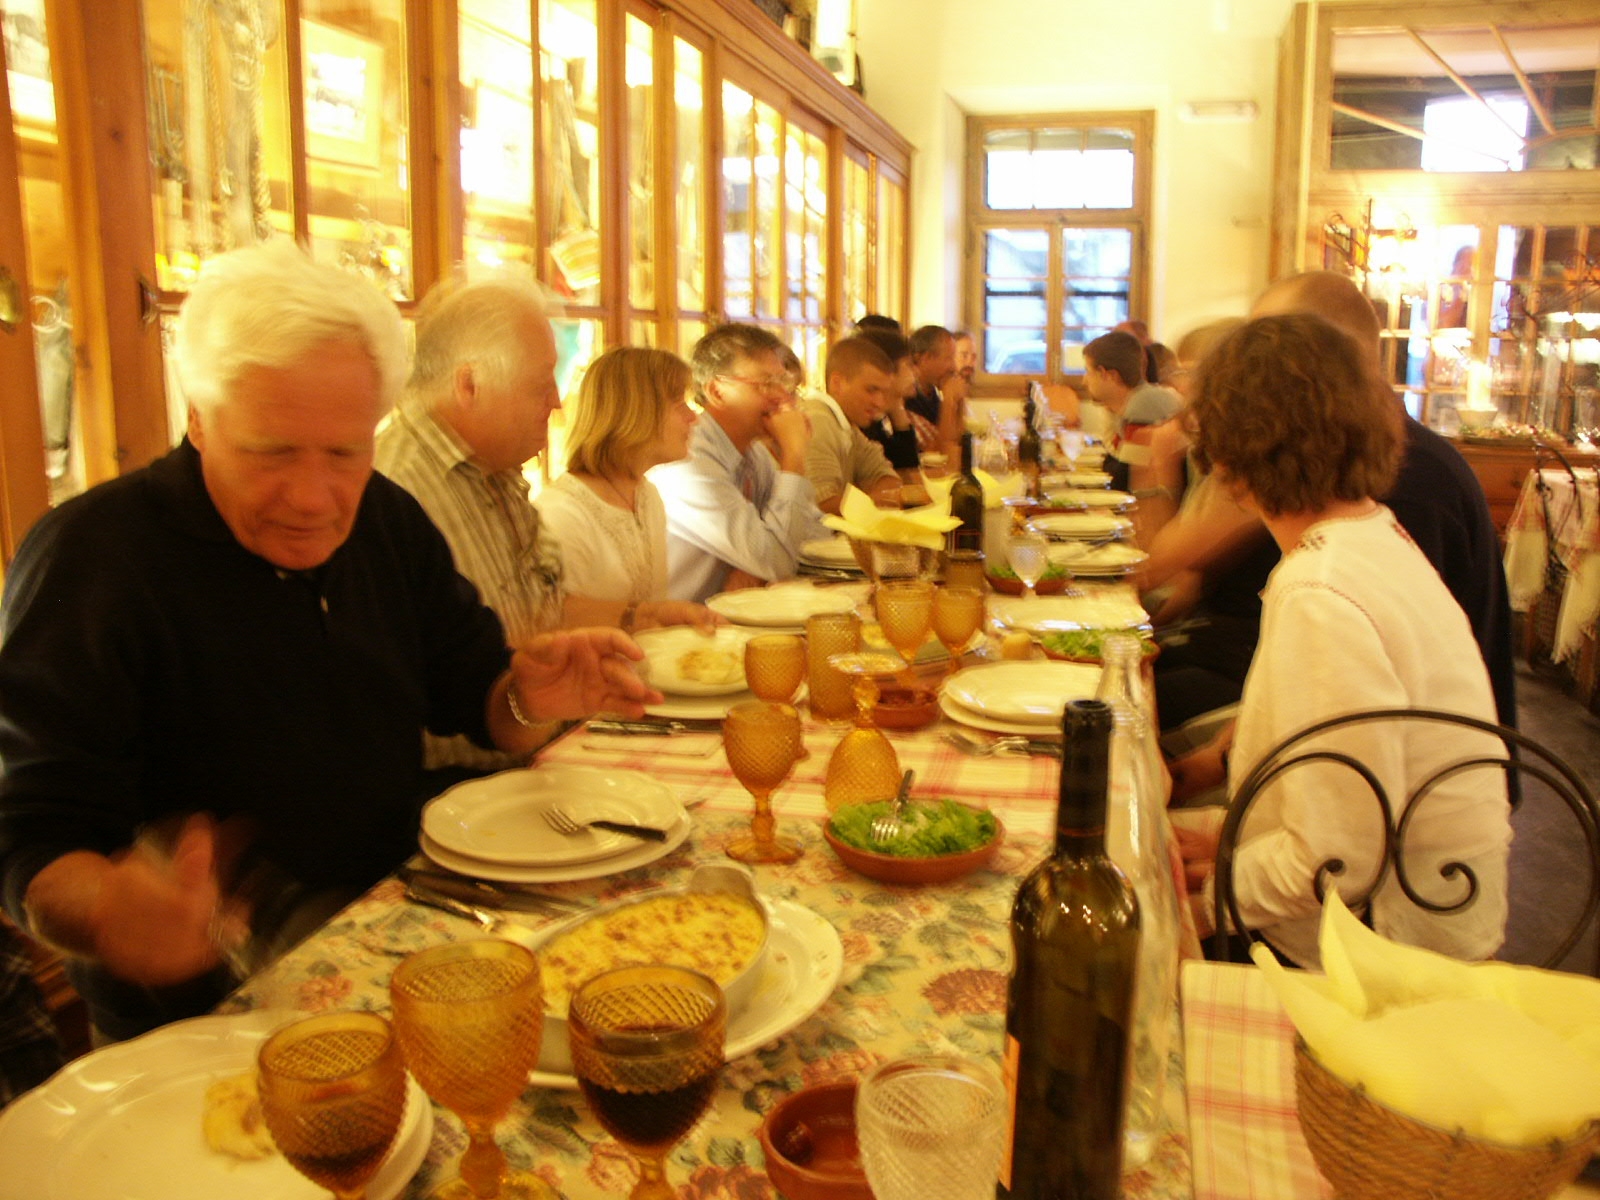
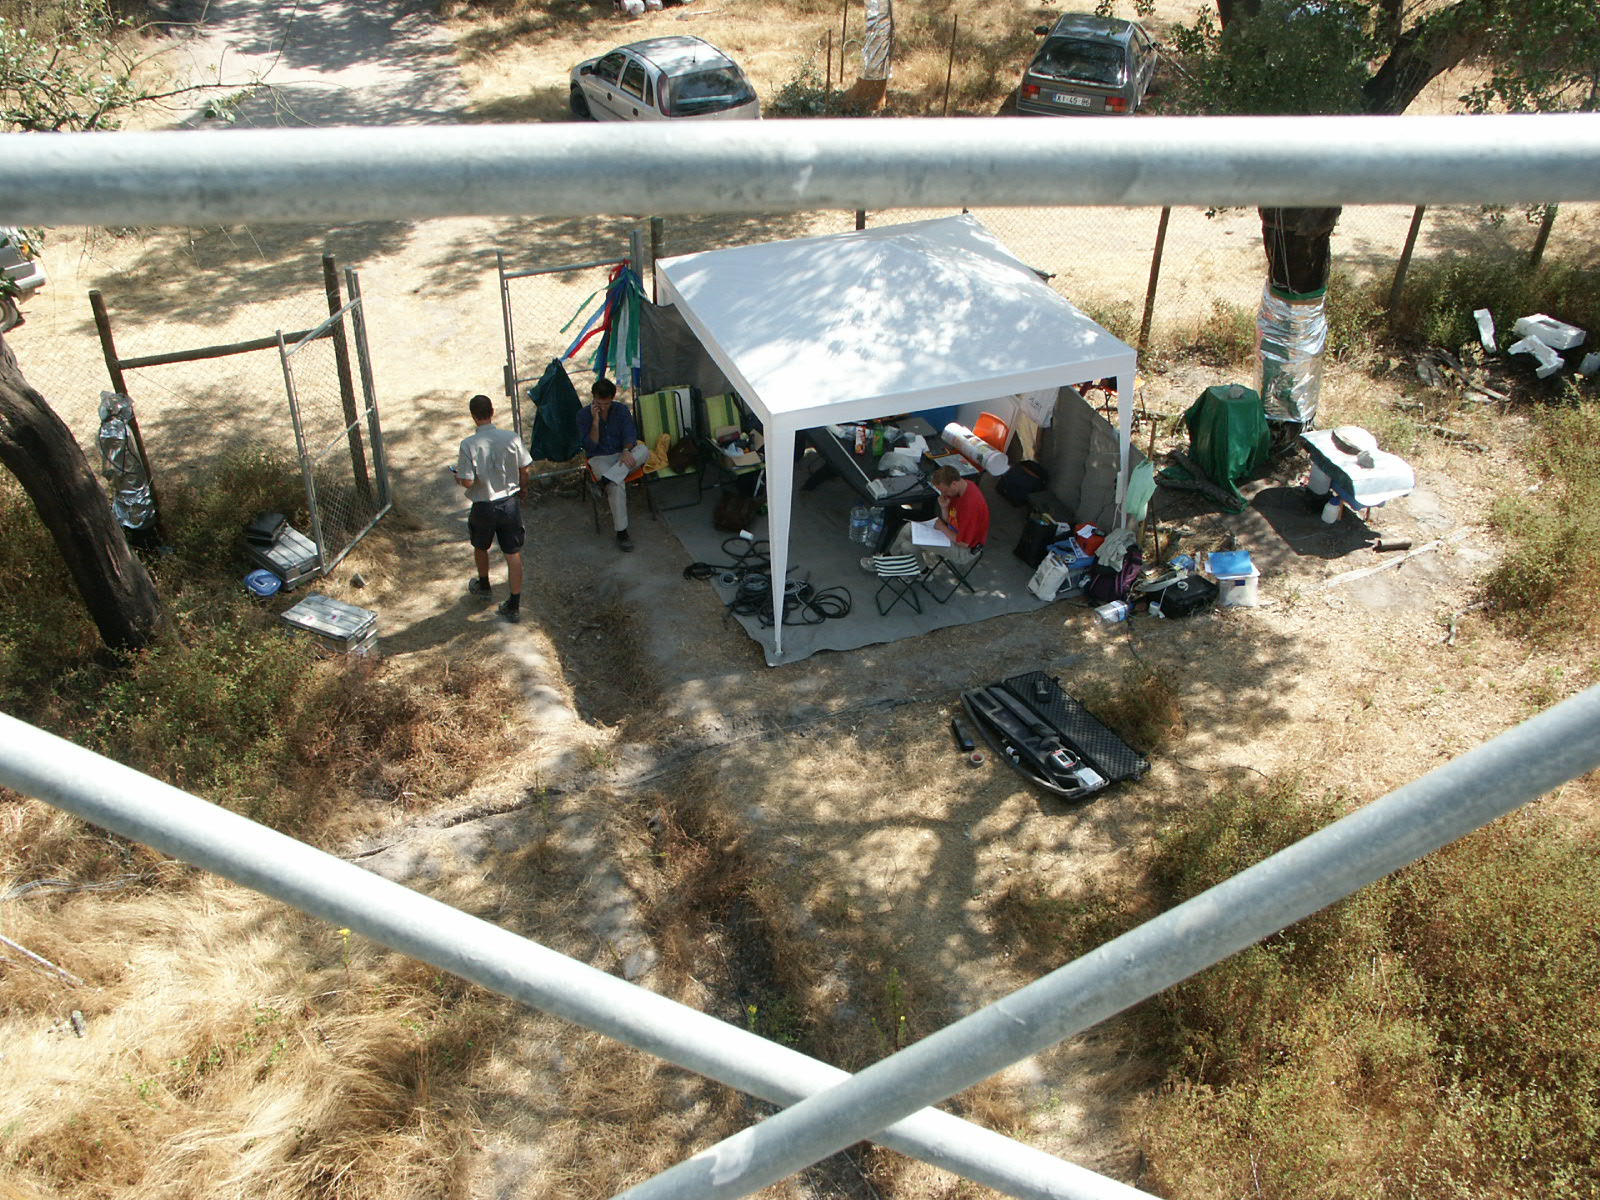 Operations center at Rio Frio
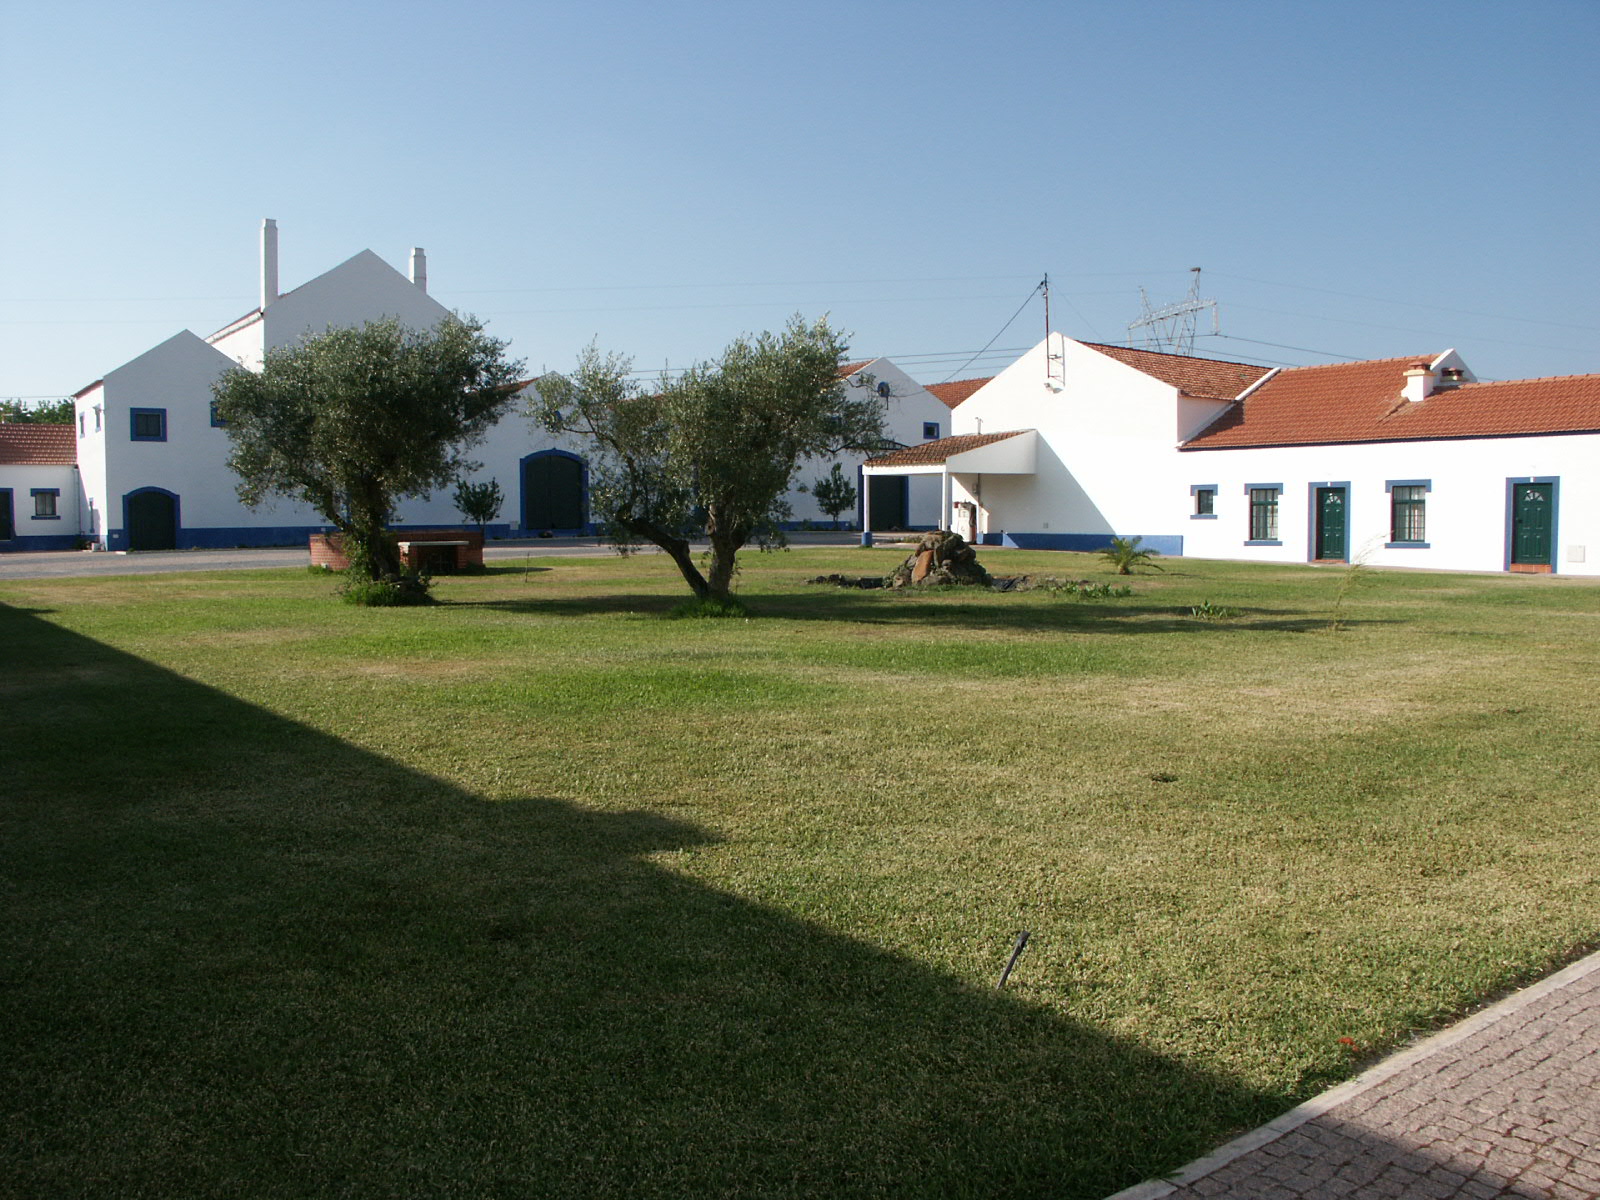 Participants of IOP 2 stayed at